On Low Treasury Yields
A pragmatic approach to Treasurys
Toward the end of the dot-com bubble on December 31, 1999, the US 10-year Treasury traded at a 6.4% yield, up from 4.6% the previous year. The Fed was raising interest rates, and the yield curve had inverted 18 months prior. Financial conditions were tightening as concerns rose about a valuation bubble.
Yet the financial press was focused on the promise of equity returns. “The upward march of the stock market indexes has become so inexorable in recent years that most strategists no longer weigh whether the market will rise next year,” Gretchen Morgenson wrote in her December 20, 1999, article titled Stocks Forecast Good but Worries Exist. “Instead, they speculate on just how much higher it will go.”
The conversation around Treasurys, in contrast, centered, as it always has and still does, on themes such as investors getting caught flat-footed by a recent rise in rates, the negative impact of the fed raising rates, and the specter of rising inflation as the economy boomed. A December 31, 1999, CNNMoney article titled Bonds: Can it get worse? started “Treasury bonds fell Friday, ending one of the bond market’s worst years on record, when inflation-wary investors fled the relative safety of fixed-income securities for the higher returns of stocks.”
Yet it was Treasurys, not equities, that ended up being the better bet. The S&P 500 total return was negative from 1999 to 2006, while the 6.4% Treasury returned more than its yield.
Today, the 10-year Treasury yields a paltry 1.5%. With real rates negative, the near-consensus view is that rising inflation will end the 35-year Treasury bull market. And commentators are arguing that Treasurys at 1.5% have far less upside than they did at 6.4%.
These low rates, combined with fears of inflation, have many convinced that Treasurys are no longer useful as a negatively correlated safe-haven asset. Thus, they argue, Treasurys might no longer deserve an important role in portfolios (keep in mind that the traditional 60/40 portfolio has a ~20% weight to government bonds).
We are certainly sympathetic to these views, and much of our research has focused on inflation and will continue to do so. But we are not sold that Treasurys have lost their usefulness. A few weeks ago in Do Treasurys Still Work? we argued that Treasury rates have continued to move with nominal growth, rallying during the COVID recession and selling off as growth returned, just as would be expected.
This week we wanted to address the common feedback we’ve received: At 1.5% yield, or even at 2%+ yield if growth continues, the return impact of Treasurys in growth slowdowns is sure to be more muted than in the past. On its face, this objection is true. A yield of 1.5% is less than 6.4%, so a buy-and-hold strategy will return less. But what is interesting is that the expected price return has not significantly changed.
The first reason the expected price return has not changed is that rates tend to move by about the same amount at 1% as they do at 6%. To illustrate this point, we show one-year forward change in the 10-year Treasury yield overlayed with the yield level.
Figure 1: Time Series of 10Y Treasury Yield and 1Y FWD Change in Rates
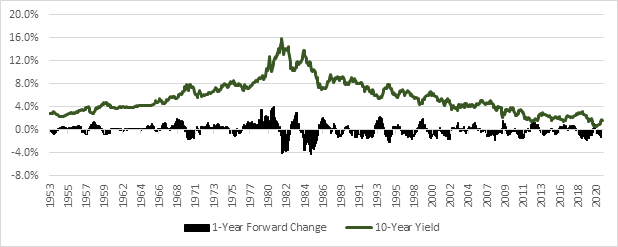
Source: Bloomberg
Except for the period of very high interest rates from 1979 to 1985, the annual movement in interest rates has been consistently between -2% and +2%. This includes both the period through 1978 when inflation was rising and after 1985 when inflation was falling. Except when rates are very high, the level of rates does not seem to drive the magnitude of change in rates. This is even more clear when we look at the same data in a scatter plot.
Figure 2: Scatter Plot of 10Y Treasury Yield and 1Y FWD Change in Rates

Source: Bloomberg
The movement of rates when bonds are at 5–9% yield is very similar to the movement of rates when bonds are at 0–5%.
The second reason that the expected price movement of the 10-year Treasury has not changed as rates have fallen is that the price multiplier, or duration, of a bond rises as rates decline, so the same change in rates has a bigger impact on the bond price when rates are lower. Below we show the duration of the 10-year Treasury bond over time.
Figure 3: Yield and Duration of 10-Year Treasury
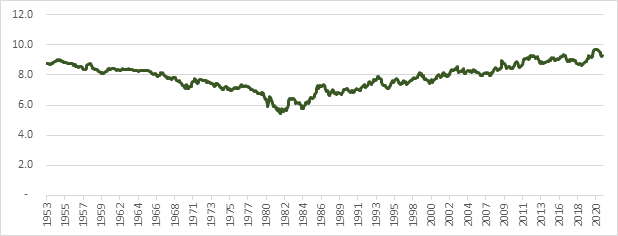
Source: Bloomberg
For better or worse, the 10-year Treasury will move more in price in reaction to rate changes when rates are lower, like they are now.
That’s what the data says, but what has really happened in history? Below we show the chart for Treasury returns, both total return, including coupon, and price return during peak-to-trough S&P 500 index drawdowns of more than 10%.
Figure 4: Treasury Returns during S&P 500 Drawdowns of More than 10%

Source: Bloomberg. S&P returns are for the S&P 500 index. Treasury returns are calculated from the 10-year constant maturity yield.
We showed a lot of data here, but there are a few things to note. In general, Treasury prices have been more likely to move opposite of equity prices when rates are low, like in the 1950s and early 1960s and since the late 1990s. But when rates are high, Treasury prices are more likely to move with equity prices. Surely, this is a strike against Treasurys. Doesn’t this just confirm that Treasurys are terrible if rates are going up?
Well, no, because we based the above on S&P 500 returns, and those can be driven by many factors other than just growth. Treasurys are more simple. As we argued before, they react primarily to growth. If we redo the above chart just to show returns during NBER-dated recessions when growth is by definition negative, the story is much more consistent.
Figure 5: Treasury Returns During NBER-Dated Recessions

Source: Bloomberg, Fred. S&P returns are for the S&P 500 index. Treasury returns are calculated from the 10-year constant maturity yield. Pandemic recession end date is estimated as not yet official.
This is the story we would expect to see, and it may be surprising to many readers. With the exception of the 1973–1975 recession, Treasurys had positive price returns during recessions and always had positive total returns.
So, as in all investing, the answer is complex and somewhat unpredictable. But what is clear is that Treasurys have worked as a countercyclical asset. Measured in periods when S&P 500 drawdowns exceeded 10%, Treasurys had compound annual returns of 5%, versus -26% for the S&P 500. Measured during periods of NBER-dated recessions, Treasurys returned 13%, versus -3% for the S&P.
We are not arguing that you should be a Treasury bull or even buy Treasurys now. The best way to earn return over the long term is to provide capital to companies and to be invested in the risky enterprises that deliver goods and services. But you should be a Treasury pragmatist. They serve a valuable role in the portfolio, especially in an active portfolio that increases or reduces risk based on the economic cycle. There is no other asset that we can think of that provides portfolio insurance and pays a positive coupon. If I tried to sell you an asset that was likely to trade up during recessions and yet pay you to own it, you’d be trying to figure out how the con worked. But that is how Treasurys act.
But being a Treasury pragmatist also means accepting the reality that there are times when Treasurys lose. A growth environment will naturally be bad for Treasurys because they move counter to growth, as we discussed in our previous piece. But when Treasurys really fail an investor is during inflation, especially if that inflation coincides with a recessionary period when Treasurys should be providing protection. For that, investors need a plan for how to handle inflation, a topic we’ll revisit next week. But Treasurys should be a part of the asset allocation discussion. Even when rates are low, and even when inflation concerns are high.