Doctor Copper
Understanding Copper's Link with the Economic Cycle
By: Verdad Research & David Balass
To prepare for a sea war with France, in 1807, Britain re-hulled the Royal Navy fleet with copper. This additional demand caused copper prices to more than double, sending them to the highest level of real prices on record ($27,400/ton in today’s dollars versus current price of ~$10,000/ton).
This episode marked one of the first copper booms and busts in recorded history, but it certainly was not the last. A cursory glance at copper’s price history reveals its highly cyclical nature.
Figure 1: Real Copper Prices (1850–2016)

Source: USGS, Winton
The likely reason for copper’s cyclicality is that copper, like oil, is linked to the economic cycle and the aggregate level of business activity due to its widespread applications throughout the economy. Copper is sometimes referred to as “Doctor Copper” because of its ability to gauge the health of the economy and foretell turning points in business activity. In good times, when businesses expand and consumer spending is high, more copper is needed for factories, cars, or consumer electronics, which is why copper should perform best at the beginning of business cycles, when the economy is booming.
To test that hypothesis, we looked at three-month forward returns of copper futures by three-month trailing changes in the high-yield spread. A falling high-yield spread suggests the economy is expanding, while a rising high-yield spread suggests the economy is slowing down.
Figure 2: Annualized 3M FWD Returns of Copper Futures by Quartile of HY Spread Change

Source: Bloomberg, FRED
Historically, copper has performed best when the high-yield spread was falling, a proxy for a growing economy, and worst when the high-yield spread was rising, a proxy for a slowing economy. Armed with this insight, we replicated the simple strategy that we had previously created for oil (see On Oil) and applied it to copper: if, over the last three months, the high-yield spread has fallen, then our strategy goes long copper futures. In the event of rising spreads, we tested three alternative scenarios: the first one involves keeping the capital out of the market entirely when not invested in copper futures (“L/Out”); the second scenario goes long 10-year US Treasurys when not invested (“L/10Y T”); and the third scenario adopts a shorting component based on the same high-yield signal, which ensures that the investor is either long or short copper futures at all times (“L/S”).
Below we compare the performance of this strategy and its various constructions with a simple buy-and-hold approach in copper.
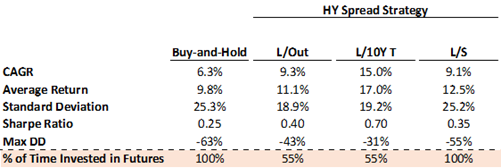
Figure 3: Performance Indicators for HY Strategy with Different Combinations (1989–2020)
Source: Bloomberg, Verdad
Evidently, timing the business cycle based on the high-yield spread dramatically improves copper performance. In the “L/Out” scenario, when the portfolio earns 0% nearly half the time, the signal helps improve performance by 300bps while reducing drawdowns by a third. Similar to our results for oil, the winning strategy is to go long 10-year Treasurys when spreads are rising, as doing so produces the highest returns, lowest drawdowns, and highest Sharpe ratio of all four combinations.
We can then explore how this strategy would perform within the context of a traditional portfolio. Below, we compare the returns of a 60% stock, 40% bond portfolio to a portfolio comprised of 60% stocks and 40% the “L/10Y T” copper strategy.
Figure 4: Strategy in Context (1989–2020)

Source: Bloomberg, Verdad
Combining this strategy with a traditional portfolio produces a strategy that outperforms both a traditional 60/40 and our copper strategy alone in terms of Sharpe ratio.
Copper vs. Oil in Your Portfolio
Readers might notice striking similarities between oil and copper: both are at their best in the first half of the cycle, and returns and drawdowns for both can be enhanced using the high-yield spread signal. So why hold both? Copper has had lower drawdowns historically and better buy-and-hold returns—should investors then cut oil from their portfolios? At the same time, the oil high-yield strategy outperforms the copper one—should investors then cut copper from their portfolios instead?
The answer is none of the above. While both oil and copper perform best in the first half of the cycle, their performance varies in different early cycle stages. We show below annualized three-month forward returns by cycle stage, as estimated by the level and direction of the high-yield spread (see The Best Macro Indicator) for three asset classes that do particularly well at the beginning of the cycle: copper, oil, and the S&P 500.
Figure 5: Annualized 3M FWD Returns by Estimated Business Cycle Stage (1990–2020)

Source: Bloomberg, FRED, Verdad
The results indicate that while oil is a top performer during economic recoveries, copper performs best when the economy is expanding.
Conclusion
Copper’s relationship with economic cycles has played a role in the metal’s explosive rally over the last year or so. As with previous booms in copper, the necessary ingredient for this cyclical upturn is the prospect of surging demand coupled with sticky and finite supply, both of which seem likely. On the demand side, the “green transition” is likely to lead to a surge in copper demand due to the metal’s crucial role in both the electrification of the economy and the development of renewable energy, so much so that the 2020s may prove to be the strongest period of volume growth in global demand for copper in history. On the supply side, copper cycles tend to be longer than the average commodity cycle because it takes significantly longer to establish new mining projects and extend existing mines.
The macro-economic environment is also supportive. The high-yield spread is below its 10-year trailing median and falling on a three-month basis, suggesting the economy is in or heading toward exactly the stage when copper performs best: expansion.
Acknowledgment: This piece was authored by David Balass. David previously studied finance and economics and is now finishing a double-degree in common and civil law (JD/BCL) at McGill University. David scored the highest grade ever on the Verdad Intern Markets Exam and has great passion for markets and investing.