Cash and Equivalents
Considerations for Investors Holding Large Cash Allocations
With a long enough time horizon, the asset allocation that achieves the highest absolute returns is 100% equities. But very few investors actually follow this model. Equities are just too volatile, and the frequency of extended losses too great.
Even the most equity-oriented investors, because they are worried about risks on the horizon or are waiting for a more attractive entry point, often end up holding large portions of their portfolio in cash and equivalents. The average high-net-worth investor holds 15% of their net worth in cash (and an additional 21% in fixed income).
So what should investors do with their sleep-at-night money if they want it to produce some degree of yield without risking excessive capital losses? We think about fixed income not as an alternative to equity, but as a cash alternative that helps to first preserve wealth and second to provide income to minimize the opportunity cost of safety.
Let’s start by looking at the incremental returns of several fixed-income asset classes and equity, ordered by increasing risk. We use US data because that is our richest data source.
Figure 1: Incremental Returns for Increasingly Risky Assets, January 1973 – May 2021
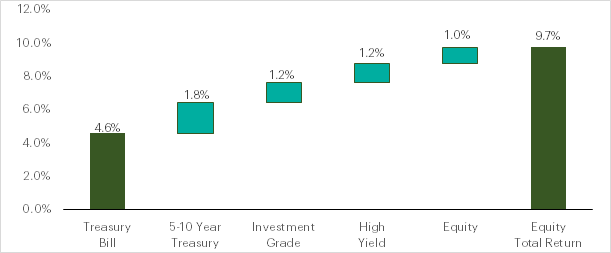
Source: FRED for Treasury bill. Verdad calculations for 5- to 10-year Treasury return based on blended 5- and 10-year returns. Bloomberg Barclays Indices for investment grade and high yield. MSCI for equity returns. Incremental returns are very similar when long datasets are used beginning December 1925. Note that total equity return would have been 10.7% using only large caps (S&P 500), increasing incremental equity return to 2.0%.
When adding risk (first by adding duration risk with Treasurys, then by adding credit risk with investment grade and high yield, and finally by adding equity risk), returns are increased by almost 5% (this is referred to in the academic literature as the equity risk premium). But the incremental risk is not spread evenly across the above distribution. Treasurys and corporate credit (investment grade and high yield) are much less likely to experience drawdowns and experience much smaller average losses.
Figure 2: Probability and Severity of Drawdowns over Three Years

Source: Same as Figure 1. Note that for fixed-income assets, we assume that the assets are rebalanced, meaning we buy a new five-year Treasury note every month. This will overstate drawdowns for fixed-income assets because they could also be bought and held to maturity.
The incremental returns from equity come at a heavy cost. Equities lose money 12.5% of the time over a three-year period, with an average loss of 20.3%. But for investors unwilling to hold all equities, cash is probably not the right answer either for the simple reason that there is a real opportunity cost to holding cash and therefore a future relative wealth impact if the portfolio falls far behind growth in the economy.
We believe that the optimal fixed-income portfolio combines both Treasurys and corporate credit (investment grade or high yield) and that the most attractive portfolios hold more corporate credit than one might think. The reason to combine the two is that Treasurys tend to do best when the economy is doing badly, and corporate credit tends to do best when the economy is doing well, which we’ve written about here. We can see this by looking at returns during one-year periods when equity returns are negative (20% of the time) versus positive (80% of the time).
Figure 3: Avg Fixed-Income Returns in 1Y Periods When Equity Returns Are Negative vs. Positive

Source: Same as Figure 1.
As in all asset classes, combing assets with different return paths reduces risk without reducing returns. Diversification works especially well in fixed income because it improves the output we care most about: drawdowns.
We can further improve returns in corporate bonds by focusing on the cross-over space between investment grade and high yield—the BBB- and BB-rated bonds that have historically provided the best returns. The BB space, which contains the highest rated bonds in high yield that are just below investment grade, has historically had the best returns with an attractive risk profile. We’ve discussed this in depth in our piece on fool’s yield. But for investors who are constrained to investment grade, BBB bonds provide an attractive second choice and historically provide the highest returns in the broad investment-grade index, a distinction we discuss here.
We tested multiple portfolios to get a sense of which one provided the best risk-reward combinations. The simplest portfolio, an even split of Treasurys and high yield, using the BB index, provided the best results. Portfolios with less high yield had lower returns with slightly worse drawdown characteristics, while portfolios with more high yield had drawdowns of 10%.
Below we show the pure portfolios and sample portfolios that mix high yield and Treasurys.
Figure 4: Historical Risk and Returns by Portfolio Allocation 1983–Present

Source: FRED for Treasury bill. Verdad calculations for 5- to 10-year Treasury. Bloomberg Barclays Indices for investment grade, BB.
The performance of the 50% BB portfolio is remarkable, producing a 4.5% return above Treasury bills with only a 10% chance of a drawdown over a one-year period, the worst of which was 3%. Relative to other options, the simple split portfolio is the best. But there is a caveat. The period we chose because of data availability coincides with falling rates. But we can create an imperfect but useful proxy for the portfolio using a mix of BBB and high yield going back to 1962. The relative results hold: a corporate credit and Treasury portfolio delivers the best returns, but the probability of drawdown for our chosen portfolio extends into the second year at 5%, and the worst draw is 9% over one year and 6% over two years.
Right now, a portfolio that is 50% Treasurys and 50% BBs yields ~2.3%. And if your reaction is, well that’s too low to bother, just remember that this is always the case and is in line with historical spreads to Treasury bills now at a zero yield. A safe portfolio should not tempt you with yield, it should tempt you with the relative certainty of earning a return. It should tempt you with relatively low drawdowns when equity assets are deeply negative.
One final point. We have written a lot about the high-yield spread as an indicator. When it is low, risk assets are less attractive, and they are attractive when it is high. The conclusion that many people jump to is that they should not own high yield when spreads are tight. That is true of riskier, lower-rated high yield, which generally undercompensates investors for risk. But it is not true of higher-quality high yield and investment grade. Low spreads signal lower future returns for all assets but with great uncertainty. Spreads can remain low for a long time. If you are focused on avoiding drawdowns, you should increase the portfolio we’ve just outlined when spreads are tight so you can be paid to wait. Don’t worry, you can reduce your exposure to high yield when spreads are wide. You will have preserved your capital and positioned yourself to take advantage of far more attractive opportunities than are available today.