Has Private Credit Broken the High-Yield Spread Signal?
The high-yield spread has stubbornly signaled optimism since June 2022
By: Greg Obenshain
Since June of 2022, the high-yield spread has shrugged off every macro concern and fallen to historic lows. A low spread signals lower default expectations and lower demand for risk compensation, allowing for lower financing costs. Even with last week’s sell-off, the spread remains nearer to historic lows than to the long-term median.
Figure 1: High-Yield Spread
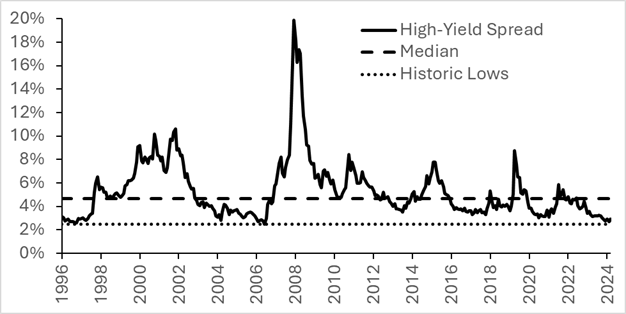
Source: FRED
We view the high-yield spread as one of the most transparent and useful macroeconomic signals we use. The relentless decline in spreads raises a concern. Has something changed about the high-yield market that renders the spread less informative than in the past? We don’t have to look too hard to figure out what that might be. While high yield used to finance the riskiest borrowers, the rise of leveraged lending, first with leveraged loans and CLOs and now with private credit, means that many of the smallest and most levered borrowers now no longer issue high-yield bonds. The canaries in the coal mine have gone private.
The numbers are staggering. While the Bloomberg High-Yield Index has about $1.4 trillion of bonds, it is matched by the leveraged loan market with $1.3 trillion of loans, according to Fitch, and is now exceeded by private credit lenders with as much as $2 trillion of private credit assets, according to McKinsey. While the private credit market has experienced rapid growth in the past ten years, the high-yield market is the same size as it was in 2014. Furthermore, over the same period, the share of BBs, the highest-rated portion of the index, has climbed from 41% to 51% of the high-yield index. The high-yield market has gotten safer as private markets have removed risky borrowers from high yield and expanded the pool of risky borrowers in the private credit market.
With a much larger and likely riskier market, shouldn’t we be looking at private credit for signs of risk in the economy? We would love to, but we can’t. Private markets have private data and no traded prices.
If the riskiest lending is not in public view, does that mean that we can no longer rely on the now safer high-yield index to send warning signs? Is the performance of the high-yield spread since 2022 simply reflecting the performance of higher quality companies?
Fortunately, the answer to this is no. While we like to use the high-yield spread because it is easily available to everyone on the FRED website and because we can construct longer histories of it for analysis that goes back decades, there is nothing inherently unique about this measure. Any credit spread measure from a liquid, daily priced index will suffice. They all tend to move together, even if in different magnitudes. We can see changes in credit risk and appetite reflected in liquid indices even if we can’t see them in private markets. Below we show the spreads of some of the rating categories in high yield (BB, B, CCC) and investment grade (A, BBB).
Figure 2: Credit Spreads by Rating Category
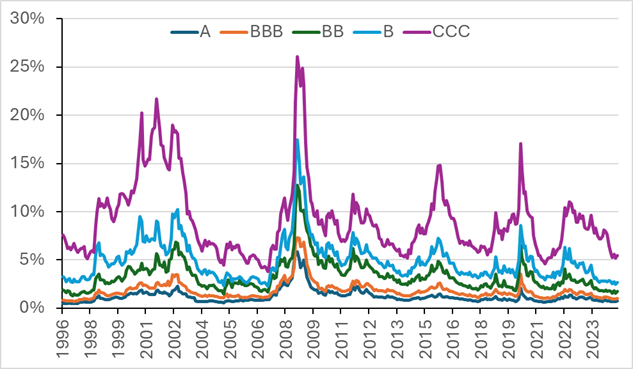
Source: Bloomberg
In fact, using lower-rated credit spreads as indicators isn’t necessarily more powerful than using higher-rated credit spreads for sorting macroeconomic regimes. To show this, we can revisit analysis we shared on the high-yield spread in “The Best Macro Indicator.” One way to see the usefulness of the high-yield spread without diving deep into regressions and statistics is to simply use it to define states of the world and then look at the next three-month average return on the S&P 500 and change in GDP growth. We recreate the results from the article below.
Figure 3: States of the World Defined by the Level and Change in the High-Yield Spread
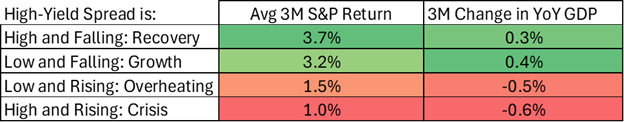
Source: FRED, Bloomberg, Macrobond, Verdad Analysis. High (low) is defined as above (below) the trailing 10-year median. Rising (falling) is defined a positive (negative) change over the trailing three months.
Now we can do the exact same exercise, but instead of the high-yield spread, we can use the CCC spreads or the BB spreads to define the states of the world. If lower-rated, riskier credit is better as a macroeconomic indicator, we would expect the white bars in the chart below (representing S&P returns in states of the world defined by CCC spreads) to be higher on the left and lower on the right than the black bars (representing states of the world defined by BB spreads).
Figure 4: Forward S&P Returns by State of World Defined by CCC and BB Spreads
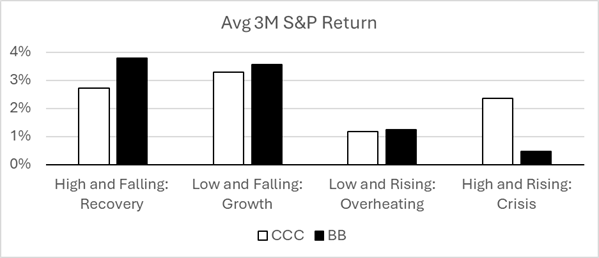
Source: FRED, Bloomberg, Macrobond, Verdad Analysis.
The opposite is in fact true: the black bar is higher on the left and lower on the right, meaning the states of the world defined by BB spreads do a better job of sorting forward equity returns.
When we repeat the exercise with change in GDP growth, the results are similar. States of the world defined by BB spreads do just as good a job, if not a better job, of sorting changes in Treasury yields, in our opinion.
Figure 5: Change in GDP Growth by State of World Defined by CCC and BB Spreads
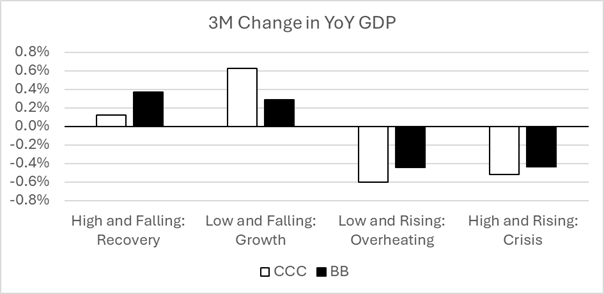
Source: FRED, Bloomberg, Macrobond, Verdad Analysis.
If we repeat this with investment-grade spreads, we get similar results. The point is not that one set of spreads is slightly better than the other, but that almost any credit spread will work. We do not need a low credit-quality index to be useful as a macro indicator. And this makes sense. Change in macro drivers of credit risk and demand for risk compensation are common across all of corporate credit. Where we measure spreads is not as important as having a liquid, constantly updated measure.
In previous research, we have cited 6.0% on the high-yield spread as the break point that defines a crisis. That level might now be slightly lower, given the ratings shift in the market since 2015. We estimate that the adjusted level would be 5.6%. But students of the high-yield spread will note that when the high-yield spread reaches that level, it usually does not hover there but moves right through on its way much higher.
So, the high-yield spread is not broken. It has correctly reflected a positive macroeconomic environment, and so far, it has been right. So where are we now? Spreads are low, and they may be rising. This does not signal an imminent crisis, but it does move us to an environment where equity returns have been lower on average.