When LBOs IPO
When a private equity firm takes a company public in an IPO, how does the company's stock perform?
We looked at every company taken public in the United States and Canada by a top-100 private equity firm since the financial crisis, a data set of 195 IPOs with an aggregate EBITDA of $66B and an aggregate market capitalization of $728B.* The average company in this data set went public with $4B in market capitalization, traded for 17x EBITDA, and was 21% leveraged on a net debt/EV basis at IPO.
We compared the average stock price return over the next year to the performance of the Russell 2000 index. Broadly speaking, our analysis showed this universe of stocks significantly underperformed the Russell 2000 index.
Figure 1: One-Year Return of Private Equity IPOs vs. Russell 2000
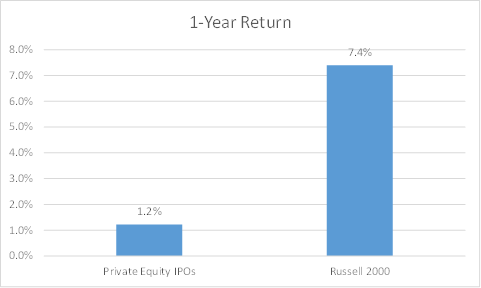
Source: CapitalIQ
We then segmented these IPOs by the valuation at IPO. We divided the universe into three buckets: companies that went public at <10x EBITDA (~20% of companies), 10–15x EBITDA (~20% of companies), and >15x EBITDA (~60% of companies). According to our research, the cheaper IPOs dramatically outperformed the Russell 2000 index, the moderately priced IPOs return matched the Russell 2000’s return, and the expensive IPOs underperformed.
Figure 2: Private Equity IPOs’ One-Year Alpha vs. Russell 2000

Source: CapitalIQ
This data supports our worldview. Cheap leveraged equities on average do very well. Expensive leveraged equities on average do badly. The top 100 private equity firms do not have a magical value creation wand. By and large, we observe their IPOs underperform. Cheapness and leverage are the keys to investment success.
*We pulled every sponsor-backed IPO since 2008 from CapitalIQ. We looked at the subset of IPOs where one of the top 100 private equity firms (using PEI’s list) was a top-five owner of the shares at IPO. We included companies that went public on NYSE, Nasdaq, or the TSX exchanges. We excluded financials and pharmaceutical companies.