Two Centuries of Innovation and Growth
Could the best argument for growth stocks also highlight why the most loved companies are unlikely to deliver above-market rates of return over the long run?
Perhaps the strongest argument in favor of large growth stocks is that they are the most innovative companies in the economy. By innovating and creating new technologies, these large growth companies become more efficient with resources, which enables them to deliver higher profit margins and faster earnings growth than their competitors.
In 2011, venture capitalist Marc Andreessen argued that America was “in the middle of a dramatic and broad technological and economic shift,” which would see companies like Apple, Amazon, and Netflix transform wide swathes of American industry. Software, he famously declared, “is eating the world.”
Andreessen’s forecast was prescient. Those technological innovations would in fact transform broad swathes of industry in the 2010s, driving corporate earnings and productivity to unusually high rates.
Given how right Andreessen’s forecast was, investors are now faced with two fundamental questions. First, to what extent are the future benefits of innovation priced into the valuation of growth stocks today? And second, how does the innovative activity of growth stocks affect the cost of capital (expected return) of value stocks?
Financial theory suggests that markets are generally efficient at incorporating information into prices. To the extent that growth stocks are able to expand their future profits through innovation, we should expect to see investors flooding these companies with capital, driving up valuations in the process. And the less innovative firms (value stocks) will have to compete for a smaller pool of capital by offering above-market rates of return through corrective actions like cost cutting and deleveraging, plus incentives like dividend payouts.
To study this dynamic empirically, we looked at a recent landmark paper called “Measuring Technological Innovation over the Long Run” by Kelly et al. (2018). This paper provides a measure of significant patents across all industries in the United States over the past two centuries (1840—2010). Through textual analysis, the authors measure the quality of patents based on their novelty (i.e., distinctiveness from previous patents) and their impact (i.e., similarity to future patents). By this measure, the highest quality patents over the past two centuries were both novel relative to past work and impactful on the course of future patents. The top 10% of patents on this quality index are then defined in the paper as “breakthrough innovations.”
An example of a breakthrough innovation would be Nikola Tesla’s 1888 patent for an AC motor. This was among the first patents to use the phrase “alternating current”; a term that was subsequently used with great frequency in patents for electronic products throughout the 20th century. Other breakthrough patents include Morse Code in 1840, the airplane in 1906, Velcro in 1955, “1-click buying” by Hartman, Bezos et al. in 1999, and Google Pagerank in 2001.
So how does the pattern of innovation look over the course of history, and where do we stand today? The figure below displays the number of breakthrough patents per capita since 1840.
Figure 1: Breakthrough Patents (Top 10% of Quality) per Capita

Source: Kelly, Papanikolaou, Seru, and Taddy, “Measuring Technological Innovation over the Long Run” (2018).
Technological innovation has proceeded in waves. Periods of accelerating innovation were followed by decades of slower innovation until the “next big thing” was discovered. Each of the three major innovation waves was driven by different industries. The mid-to-late 1800s were characterized by advances in electricity and railways during the second Industrial Revolution. The next innovation wave in the 1920s and 1930s was driven by advances in manufacturing and chemicals. And the most recent wave since the 1980s has primarily been driven by innovations in computing. Figure 2 displays the number of breakthrough patents by select industries over the past two centuries. Notice the significantly larger scale in the right-hand panel representing computers and electronic products.
Figure 2: Number of Breakthrough Patents Across Select Industries

Source: Kelly, Papanikolaou, Seru, and Taddy, “Measuring Technological Innovation over the Long Run” (2018).
Importantly for investors, breakthrough innovations forecast higher productivity in the future. As shown in the figure below, a one standard deviation increase in the breakthrough innovation index is associated with 0.5 to 2 percentage points higher annual productivity growth over the next 5 to 10 years.
Figure 3: Breakthrough Patents and Aggregate Productivity
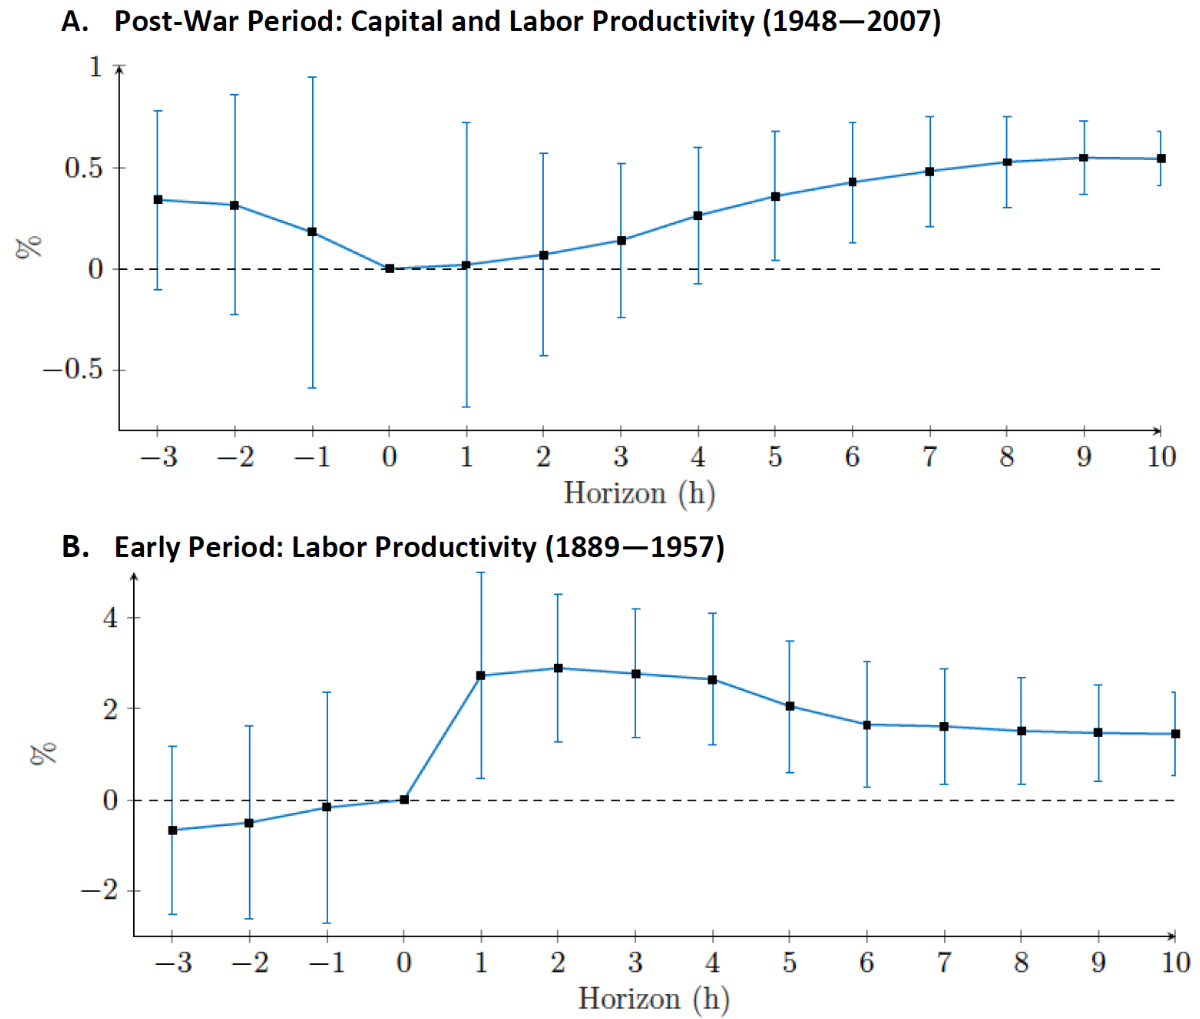
Source: Kelly, Papanikolaou, Seru, and Taddy, “Measuring Technological Innovation over the Long Run” (2018).
As shown earlier, we are currently in the tail end of a major innovation wave that’s been driven by large technology companies. So it’s interesting to note that the magnitude of the predicted productivity gains (0.5% to 2% per year) aligns with the 1.5 percentage point increase in real earnings growth among S&P 500 companies over the past 10 years.
Figure 4: S&P 500 Annualized Real Earnings Growth (1926—2019 vs. 2010—2019)
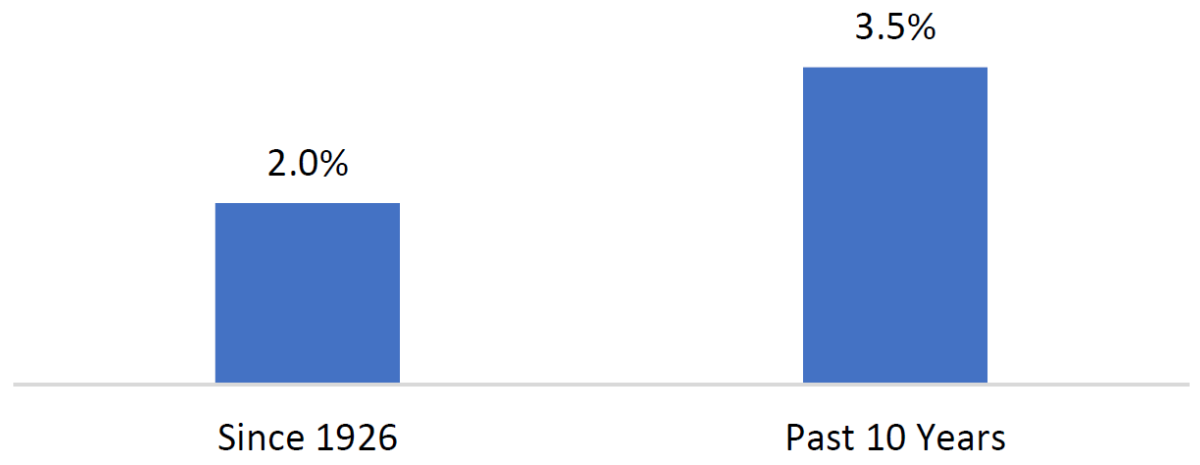
Source: Robert Shiller’s website. Data as of December 31, 2019.
This is Andreessen’s prediction turned reality. And investors have responded by rewarding the innovative companies that drove this massive earnings growth with an ever-lower cost of capital. When Andreessen wrote his piece, Amazon traded at 2x sales, whereas today the company trades at almost 4x sales; Netflix traded at just over 3x sales, whereas today the company trades at almost 9x sales; Apple traded at 4x sales, whereas today the company trades at just under 5x sales. Investors have rewarded these companies for their innovation, and, if multiples are an indicator, they are betting that the rates of growth and innovation will be higher in the 2020s than in the 2010s.
The bet that growth stocks will continue to eat the world is evident in the fact that valuation spreads between cheap and expensive stocks are now at the 99th to 100th percentiles across a variety of measures, including Price/Book, an adjusted version of Price/Book that accounts for intangibles, and Price/Sales, as shown in an excellent paper by Research Affiliates. While growth stocks have soared to ever higher heights, value stocks have struggled to attract investor capital over the past 10 years—even though value has delivered handsome returns over the past century of reliable stock market data since 1926.
Figure 5: US Annualized Returns by Market Segment (1926—2020 vs. 2010—2020)

Source: Ken French’s website. Data as of March 31, 2020.
The key question for value investors then is how will the innovative activity of growth stocks affect other companies in the economy over the long run? A related paper by Kogan et al. (2017) on innovation and resource allocation looks at how capital productivity (i.e., return on capital) is affected by a firm’s own innovation relative to innovation by a competitor. The evidence on capital productivity suggests that competitors are negatively affected by innovation in the short term with a 1 to 2 percentage point decline in return on capital (e.g., because of business stealing). But after 3 to 5 years, the net effect is zero to positive as these competitors adjust to the new environment by cutting unprofitable production and incorporating any knowledge spillovers into their production systems. As a result of these corrective measures, return on capital is around 1 to 3 percentage points higher among competitors after five years.
Figure 6: Change in Return on Capital over 5 Years After Innovation (1926—2010)

Source: Kogan, Papanikolaou, Seru, and Stoffman,“Technological Innovation, Resource Allocation and Growth” (2017).
Kogan et al. also find evidence that innovative firms (growth stocks) receive more capital inflows through share and debt issuances over the short term. In response to this abundance of capital inflows, the most innovative firms ramp up their investment spending by 5% to 6% relative to the median company. In contrast, the non-innovators (value stocks) tend to increase their capital payouts (dividends and deleveraging) and reduce their spending by 7% to 13% relative to the median company in an effort to attract capital. Evidently, growth stocks face a low cost of capital because they can easily raise money from many eager capital providers. On the other hand, value stocks must compete for a more limited pool of funds so they face a high cost of capital. Since investors are capital providers, the companies’ cost of capital is the investors’ expected return.
The upshot is that value stocks have a much stronger incentive to take actions that would offer investors above-market rates of return over the long run. Less innovative firms (value stocks) will have to compete for a smaller pool of capital by offering above-market rates of return through corrective actions like cost cutting and deleveraging, plus incentives like dividend payouts. They simply have to do so in order to attract capital. On the other hand, large growth stocks’ breakthrough innovations and fat profit margins attract capital like bees to a honeypot. Growth stocks are able to raise capital by just offering the market rate of return.
The long-term data reinforces this relationship between innovation and cost of capital. Throughout multiple innovation waves over the past century, beloved large growth stocks have compounded at 9.7% per year, which is identical to the market return of 9.7% per year over the same period. The most loved innovators have not outperformed the market over the past century, simply because they didn’t need to in order to attract capital. And throughout the same innovation waves over the past century, small value stocks have compounded at 13.8% per year, delivering on their offer of above-market returns over the long run. This relationship makes intuitive sense. In a free market where investors can choose where to allocate their money, why else would investors provide capital to value stocks—companies that lack an innovation story—unless they are induced by an offer of above-market returns?
But the key to realizing those returns is to stay the course in value, especially during stretches of disappointing relative performance when expected returns going forward are probably higher than average. Few points in history have seen valuation spreads as wide as we have today. And we think this implies an even bigger inducement to allocate capital to value stocks. We believe cheap companies that are profitable and cash flow generative will have the flexibility to adapt to the new environment, as other value companies have done over the past two centuries of innovation.