Tail Risk Hedging
Tail risk hedging is asset allocation on steroids, and investors need to understand the costs and the full range of options
We asked our friend and expert in this area, Kai Wu, to help us provide a framework for evaluating tail risk investments in an unbiased way. Kai was a member of GMO’s asset allocation team and co-founded an investment firm that ran volatility arbitrage and global macro hedge funds. He is now the founder and CIO of Sparkline Capital.
As markets plunged in Q1 of 2020, an eccentric investment strategy was the stand-out winner. Hedge funds that focus on tail risk hedging, betting on what Nassim Taleb famously called “black swans,” profited handsomely as stocks plummeted. The Eurekahedge Tail Risk Hedge Fund Index was up 57% over this period, and a few tail risk hedge funds (including one advised by Taleb) delivered eye-popping returns over +1000%. The below chart compares the performance of tail risk hedge funds in Q1 to the S&P 500 and a US 60/40 portfolio.
Figure 1: Asset Class Returns in Q1 2020
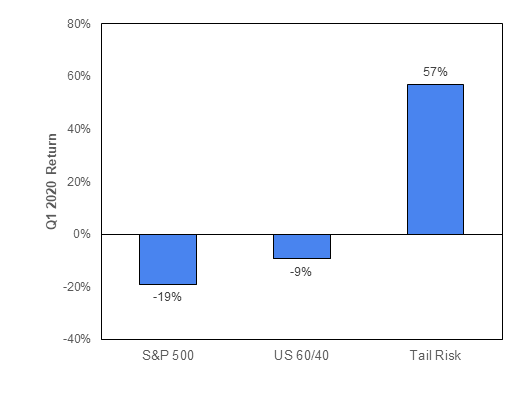
Source: Bloomberg, S&P, Eurekahedge
This outstanding performance has raised significant interest in these strategies among asset allocators. A strategy that could help smooth returns by providing strong positive profits in times of crisis when all other assets are down would be enormously valuable as a portfolio tool.
But if markets are efficient, the best hedges should also be very expensive. In the same way you pay a monthly premium to insure your home, you should expect to incur a negative return to insure your portfolio. This cost comes into focus by examining the long-term performance of the aforementioned Eurekahedge Tail Risk Hedge Fund Index.
Figure 2: Performance of Eurekahedge Tail Risk Hedge Fund Index

Source: Eurekahedge, Bloomberg
This chart shows that buyers of tail risk funds have historically paid about 3.4% per year to make 25–50% in crises. Given that the long-term equity risk premium has been roughly 3–5%, this feels like a steep cost to pay for reducing volatility in times of crisis.
In addition, the payoff profile of tail hedge funds presents unique challenges in an institutional setting. It is difficult to justify bleeding for ten years waiting for the big payoff. Tail hedges have a devilish tendency to pay out when markets are most complacent. As illustrated by the unfortunate decision by CalPERS to unwind its tail hedge program a few months before the recent selloff, successfully implementing a tail hedge program requires a godlike fortitude and long-term commitment to the idea.
But tail risk hedging strategies are only one extreme form of hedging. There are a variety of other potential hedges that investors could employ, from shorting corporate credit to owning long-duration US Treasuries. Each of these assets occupies a specific point on the tradeoff between hedge quality (broadly, the probability of paying off in a crisis and the significance of the payoff) and cost (the long-term return of the asset).
This simple framework can be applied to a broad range of potentially interesting hedge strategies using simple quantitative metrics to assess hedge quality and cost.
Hedge Quality: We use correlation with the S&P 500 as a rough estimate of hedge quality. The more negative the correlation, the higher the hedge quality.
Cost: We use historical returns from 1995-2020 as a simple proxy for long-term cost. We normalize historical returns using Sharpe Ratio (i.e., return over cash / volatility) to provide an apples-to-apples comparison across different asset classes.
The figure below illustrates this tradeoff, with hedge quality on the X-axis and cost on the Y-axis. Dark blue markers show assets held long and light blue show those held short.
Figure 3: Tail Risk Hedging Quality vs. Cost
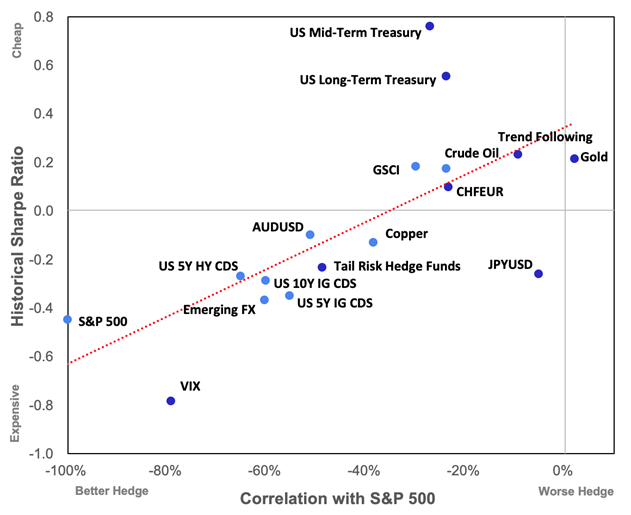
Source: Bloomberg, S&P, Russell, MSCI, Barclays, JPM, GS, CBOE, Eurekahedge, SG
This graph reveals a strong relationship between hedge quality and price. Shorting the S&P 500 or buying VIX options are the most expensive hedges but also perform the best. Shorting oil futures or betting on the Swiss franc versus the euro are much cheaper hedges but are relatively less effective. The most notable outliers are US Treasuries. However, this is an artifact of our use of the disinflationary period 1995–2020 to define historical returns. Treasuries would not be as impressive over a longer period that includes the inflationary 1970s.
How did these different hedges work in recent crises? The below chart shows the performance of each asset during the last three times the S&P 500 drew down more than 20%.
Figure 4: Tail Hedge Performance in Crises

Source: Bloomberg, S&P, Russell, MSCI, Barclays, JPM, GS, CBOE, Eurekahedge, SG. Returns are for self-funded positions in each instrument.
Every hedge except the Japanese yen delivered positive returns on average across the crises. Treasuries were consistent winners. However, this favorable result is likely particular to the disinflationary tailwinds of the past few decades. Credit default spreads (CDS) did particularly well in 2008 and 2020. Currency hedges did not work in 2000 but were otherwise helpful. Gold did not provide any big payoffs but also never lost money. Shorting energy and industrial metals proved to be quite effective in all but the 2000 selloff.
Long volatility was helpful on average, with the current crisis a standout winner. However, the current recession is still ongoing, so it is possible that these strategies may give back some of their gains before this is all over. Also, as discussed earlier, the long-term cost of buying options is much higher than other asset classes. For instance, the VIX future return has been a whopping -50% per year since inception in 2006.
Finally, trend following was disappointing. It provided meaningful protection in only the 2000 and 2008 crises. Trend following strategies tend to focus on 12-month trends. As a result, they may get whipsawed in sharp selloffs and W-shaped recessions.
Tail risk funds are merely one extreme point in a broader menu of options. Investing solely in tail risk funds forgoes the benefit of diversification. As shown below, a simple equal-weighted basket of the above hedges would have significantly outperformed tail risk hedge funds alone.
Figure 5: Diversified Tail Hedging

Source: Bloomberg, S&P, Russell, MSCI, Barclays, JPM, GS, Eurekahedge, SG
The basket of tail hedges would have offered a similar quality of hedging at lower cost. The basket approach also offers more opportunities for alpha generation by rotating into the cheapest hedge when relative valuations diverge.
Adjusting for the favorable endpoint of this historical sample leads to an estimate of the long-term cost of hedging of around 2% per year, a steep cost given an expected 3–5% equity risk premium. Even after cheapening the cost of hedging through diversification, the cost of insurance is still very high.
In some sense, tail risk hedging is just asset allocation on steroids: investors should think through the costs and the full range of options rather than sticking only to the most popular and hence expensive hedges like VIX futures or tail risk hedge funds.