When and How to Take Risk in Bonds
How to Use Relative Spreads to Evaluate Relative Returns
One of the foundational tenets of the endowment style of investing is to substantially reduce fixed-income exposure in favor of alternatives. We have argued that this “flight from safety” is too simplistic. Fixed income can play a valuable role in a portfolio, and there are substantial opportunities within credit to harvest risk premia that are diversifying to an equity-focused portfolio.
But how and when should allocators take risks in bonds? When should investors hold solid, safe investment-grade portfolios, and when should they dive down into the high-yield market? And how should fixed-income managers decide what level of risk to take within those categories?
We have consistently argued that the best static allocation would just be to BBs, the highest-quality portion of high yield, where we believe expected returns are the highest. But there are plenty of periods when investment grade outperforms high yield. We wanted to determine if there is a systematic way to inform active decisions.
One widely held belief is that investors should only allocate to high yield when high-yield spreads are wide. Like many market truisms, there is some merit to this belief. High-yield returns tend to exhibit their greatest outperformance when spreads are high, as they are now.
Figure 1: High-Yield Outperformance by High-Yield Spread Levels

Source: Bloomberg, Verdad analysis. Monthly data January 1994 – April 2020. Returns assume three-month holds. Hit rate is the percent of months in which HY returns are greater than IG returns.
But this rule is a blunt instrument. We can see from the hit rate, the percent of months that high yield outperforms, that high yield is still outperforming in 56% of the months in the worst quintile. This method is not sorting the performance very well. Spread levels are just too crude an indicator.
So how can we improve on this simple rule? We looked at using the ratio of the high-yield spread to the investment-grade spread, which takes into account the relative pricing of high yield versus investment grade.
Figure 2: High-Yield Outperformance by Relative Spread (HY Spread vs. IG Spread)

Source: Bloomberg, Verdad analysis. Monthly data January 1994 – April 2020. Returns assume three-month holds. Relative spreads measured as ratio of spreads normalized by dividing by the rolling 24-month average.
This appears to sort performance much better, with high yield outperforming in 70% of months in the top quintile when relative spreads are wide and only 32% of the months in the bottom quintile when relative spreads are tight.
This type of relative spread analysis is also helpful for determining when to take risks within fixed-income categories. High-yield investors should generally prefer BB bonds to B, as the long-term performance of BB is so much better. Comparing the relative spreads of BB to B allows us to see that there are, in fact, few times when B outperforms BB.
Figure 3: B vs. BB Performance by Relative Spread

Source: Bloomberg, Verdad analysis. Monthly data January 1994 – April 2020. Returns assume three-month holds.
Similarly, investment-grade managers can use this method to determine when allocations to BBB are better than to higher-quality credit or, more importantly, when they should be avoided.
Figure 4: BBB vs. AA Performance by Relative Spread
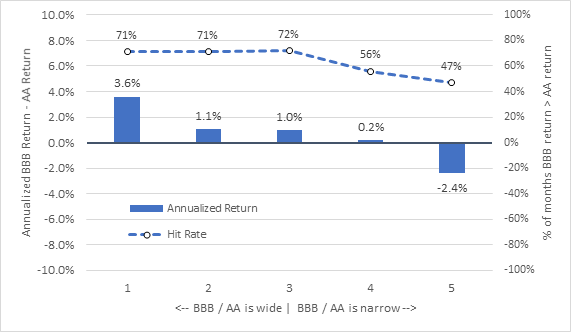
Source: Bloomberg, Verdad analysis. Monthly data January 1994 – April 2020. Returns assume three-month holds.
In this case, BBB is usually the outperforming allocation, but in the rarer instance when the BBB versus AA spread is very narrow (fifth quintile), it is a good indication that managers should avoid BBB in favor of higher ratings.
Spread differentials between ratings work better as a positioning indicator than just using the absolute spread levels. This is in part because spread differentials are not particularly correlated with spread levels, meaning they deliver useful signals that are not dependent on the spread environment. The BB to BBB spread differential, for example, has a small (-0.04) negative correlation with the high-yield spread.
So can we use this tool to see where we are today? Below we present the full matrix of spread relationships.
Figure 5: The Full Matrix of Spread Differentials (Quintiles) as of April 30, 2020

Source: Bloomberg, Verdad analysis.
Read down the column (e.g., the spread differential between A and AA is in the fifth quintile). The relationship to the next highest rating category is the lowest, bolded box in the column. As of April 30, the high yield to investment grade spread is in the first quintile, indicating a very bullish outlook for high yield relative to investment grade. But within high yield, the B versus BB spread is in the fourth quintile, a not particularly bullish indicator for single B credit relative to BB credit even though single B is attractive relative to several investment grade ratings.
Within investment grade, the general pattern is that lower ratings are trading historically wide (low quintiles) to higher ratings. This is bullish for BBB debt within investment grade. The anomaly is any rating versus AA, which suggests that the AA spread itself is wide to all ratings.
Allocators should prefer high yield to investment grade, investment-grade investors should prefer BBB to AA, and high-yield investors should prefer BB to B bonds.