The Yen Panic
The case against yen bears bears repeating
This summer, the yen reached its lowest levels in nearly 40 years. The worse the yen has performed, the more compelling the bear case has become.
Robin Brooks, the former chief economist of the Institute of International Finance and a longtime currency strategist, recently argued that “Japan’s yield caps mean that what would be a debt crisis has morphed into a currency crisis.” Indeed, he believes Japan is already in a de facto debt crisis.
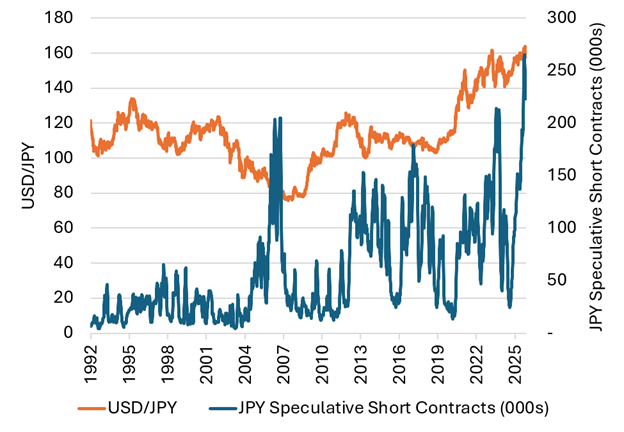
It’s a compelling story that perfectly describes the last five years, in which the yen has fallen from roughly ¥105–110 per dollar to around ¥160. In this time, Japanese interest rates were held far below US rates. The cheaper the yen got, the larger the speculative short positions became.
This summer, speculative yen shorts reached their highest level since 2007. The chart below shows the yen dollar versus speculative net yen positioning.
Figure 1: USD/JPY vs. JPY Speculative Short Contracts
Sources: Bloomberg, Verdad analysis
This looks like a classic case of hindcasting: developing an elegant causal explanation for something that has already happened and then assuming that the explanation is a forecast.
The question for an investor isn’t whether the reasons for the yen’s decline were real. They obviously were. The question is whether those reasons are still surprising and whether they are adequately reflected in the price.
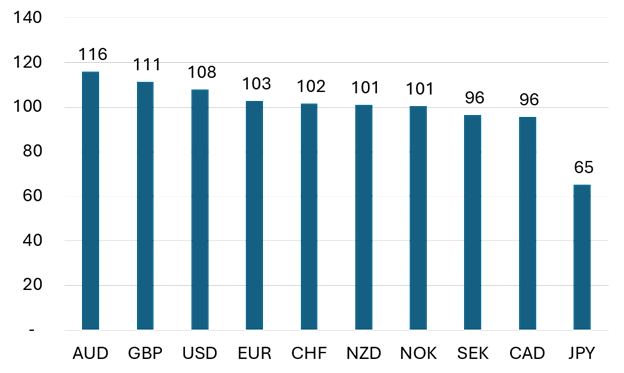
Last year, we looked at major currencies using real effective exchange rates (REERs), which adjust nominal exchange rates for differences in inflation and trade patterns. The conclusion was striking: The yen was by far one of the cheapest major currencies in the world.
Figure 2: Real Effective Exchange Rates for G-10 Currencies
Sources: Bloomberg, Verdad analysis
On a REER basis, the yen recently traded around 65 relative to a 2020 level of 100, in line with the rest of the G-10 peers. Six years ago, at roughly ¥100/$, a Japanese worker earning ¥10 million made the equivalent of $100,000. At ¥160/$, that same salary is worth $62,500. Japanese wages, goods, services, property, and productive capacity have all become dramatically cheaper in dollar terms.
Today there are signs that we may have reached peak yen bearishness. In July, the United States joined Japan in buying yen, the first coordinated US–Japanese intervention since 2011, pushing the yen from roughly ¥164/$ to ¥155/$. Academic research suggests coordinated intervention has historically been more effective than unilateral intervention.
Treasury Secretary Scott Bessent has been explicit that intervention alone isn’t enough: “At the end of the day, it’s going to be policy and fundamentals…. It is going to require a policy to follow up with the intervention.” And now the Bank of Japan has moved its policy rate from negative territory in early 2024 to 1% today, with markets assigning a high probability to another hike in September.
Being short the yen today therefore means betting against an extraordinarily cheap currency while both the US and Japanese governments are telling you they want it higher and the BoJ is raising the interest rates necessary to make that preference credible. That’s a materially different trade from shorting the yen at ¥110 with Japanese rates pinned below zero.
The bearish response is that the BoJ can’t raise rates because Japan’s government debt is simply too large. Gross government debt exceeds 230% of GDP, by far the highest among major developed economies.
But gross debt is a peculiar way to analyze a balance sheet while ignoring the assets on the other side. Earlier this year, we wrote about work by Stanford professor Hanno Lustig and his coauthors showing how dramatically the conventional debt statistics misrepresent Japan’s fiscal position.
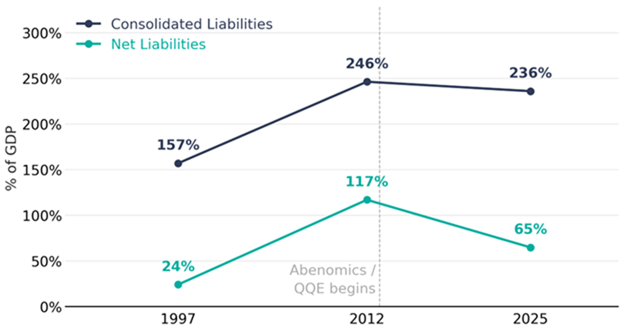
Japan’s consolidated public sector held financial assets worth 171% of GDP in 2025, more than half of which were equities and foreign securities.
Figure 3: Gross vs. Net Consolidated Public Liabilities (% of GDP)
Sources: Japan Flow of Funds, National Accounts of Japan, Chien et al., Financial Times
Once those assets are included, Japan’s net consolidated liabilities are only 65% of GDP, down from 117% in 2012. Japan has effectively created an enormous leveraged sovereign wealth fund: The government borrows cheaply and owns risky assets.
That produces a fascinating alignment of incentives. The Japanese public sector owns domestic equities worth approximately 41% of GDP. Public pension funds own around 14% of GDP and the Bank of Japan another 13%.
We think this helps explain something we have been writing about for years: Japan’s corporate-governance revolution. The Tokyo Stock Exchange has pressured companies trading below book value to improve returns on capital, unwind cross-shareholdings, increase dividends, and buy back stock.
These policies are usually described as corporate-governance reform. But when the government owns equities worth 41% of GDP, they are also fiscal policy. Higher Japanese equity prices strengthen the Japanese sovereign balance sheet. That creates an unusual alignment between the Japanese government and Japanese equity investors.
Finally, Japanese equity investors have already lived through the scenario the yen bears are worried about. Indeed, if Brooks is right that Japan is already in a de facto debt crisis, the striking fact is that Japanese equities have performed so well during it. For globally oriented Japanese companies, a weaker yen raises the yen value of overseas revenues and earnings and can improve export competitiveness, partially offsetting the currency loss borne by dollar investors. With the yen now historically cheap, speculative positioning extremely bearish, policy tightening underway, and both the US and Japanese governments pushing against further depreciation, the yen looks more like a potential tailwind than a reason to avoid Japanese equities.