The Great European Rotation
As investors reconsider their concentration in US equities, Europe’s downtrodden microcaps may offer the highest upside potential going forward.
By: Brian Chingono
As we have written before, the hyper-concentration of US equities as a share of global market capitalization reached extreme levels in recent years and was bound to reach a tipping point.
We believe 2025 may be the beginning of an international rotation, as investors reassess growth and inflation assumptions in a US market that was priced to perfection.
Europe stands to benefit from this international rotation, after an extended period of outflows triggered by the war in Ukraine and the subsequent energy and inflation shocks. In particular, we believe European microcaps have significant upside potential from mean reversion going forward.
We also believe smaller firms may potentially have an edge in the event of higher trade barriers. Small- and micro-cap firms tend to generate a higher share of their revenue domestically. Therefore, they should be less exposed to the direct impact of trade wars. However, the indirect effects of rising input costs would affect all companies alike.
European markets are up over the year-to-date period through April 25th, while expensive US equity indices have declined, demonstrating the benefit of international diversification. Germany’s announcement of €1 trillion in fiscal stimulus through infrastructure and defense spending have helped to attract significant inflows into European large caps, driving a 13% gain among the largest and most liquid stocks. Over time, we expect these fund flows to trickle down to the less-liquid microcap corners of the market, where valuations are more attractive.
As shown in the chart below, based on MSCI indices, the first quarter of 2025 was broadly a story of larger firms outperforming smaller ones in Europe while the S&P 500 dropped by -4.3%. During the volatile month-to-date period in April, European small- and micro-caps outpaced their larger peers by 2 percentage points, as fund flows worked their way down to less liquid corners of the European market. Meanwhile, the S&P 500 continued its decline with a further 1.5% drop over the month-to-date period through April 25th.
Figure 1: Returns of MSCI Size Indices in Europe vs. S&P 500 (April 25, 2025)
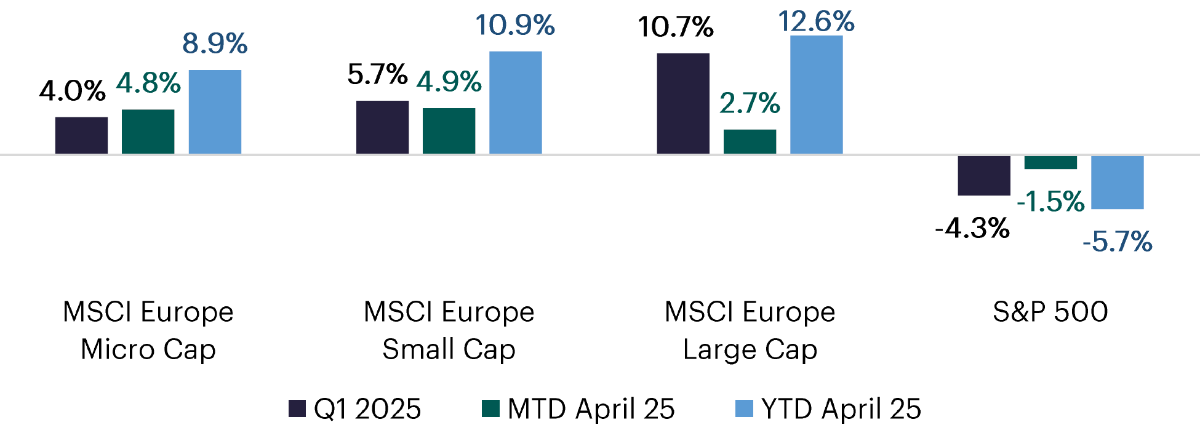
Source: MSCI. All index returns are in USD.
We believe a major driver of the double-digit gain among large caps is the rapid influx of fund flows into the European market in Q1. For example, one of the biggest ETFs tracking the broad European market received more inflows in Q1 2025 than in any other quarter over the past five years.
Figure 2: Fund Flows in Vanguard FTSE Europe ETF (April 2020 – March 2025)
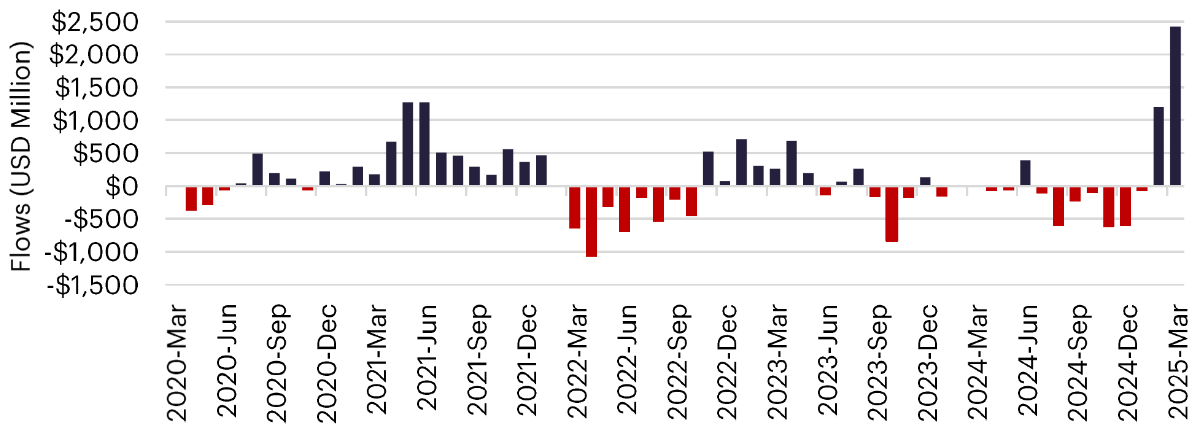
Sources: ETF Database and Vanguard
When inundated with new capital, many portfolio managers start by deploying money into the most liquid opportunities within their target list. Therefore, in our opinion, it takes some time for fund flows to trickle down toward microcaps, where valuations are most attractive and the upside potential from mean reversion appears to be greatest. As shown in the table below, microcaps make up more than half of the opportunity set in Europe. With a third of European microcaps trading below book value, the proportion of firms priced at a discount to their book equity is double among microcaps relative to large caps. And if we compare the proportion of firms trading at less than 0.5x Price/Book, we find that the proportion of deeply discounted firms is almost four times higher among microcaps relative to large caps. Mathematically, it is much easier to build a diversified portfolio of deep-value stocks among microcaps (where 225 firms trade below 0.5x Price/Book) than when selecting among large caps (where only 22 firms trade below 0.5x P/B).
Figure 3: Size and Price/Book Distribution of European Stocks (March 31, 2025)
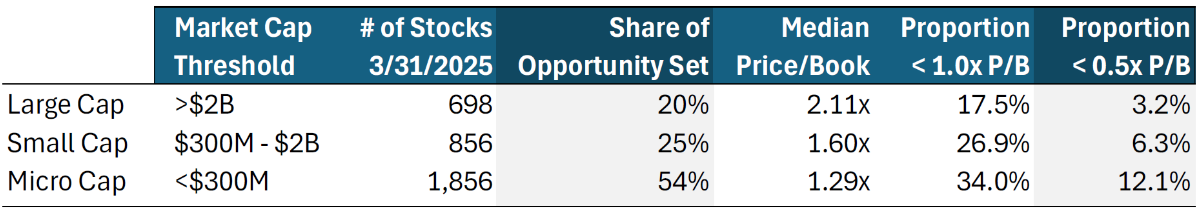
Source: S&P Capital IQ
Going forward, valuation spreads suggest there is more upside from mean reversion among the cheapest microcaps compared to the cheapest large caps in Europe. In the following charts, valuation spreads are defined as the Price/Book of value stocks divided by the Price/Book of growth stocks. Within each year from 1996 to 2024, value is defined as the cheapest third of stocks, and growth is defined as the most expensive third. Therefore, lower spread ratios represent wider distances between the two categories. Among large caps in Europe, valuation spreads have steadily narrowed over the past five years, apart from a brief interruption during the 2022 energy crisis. Today, valuation spreads among large caps remain 15% wider than their historical average. On the other hand, microcaps have seen a widening of valuation spreads since 2022, placing today’s spread level among microcaps near the extremes that were reached in 2000, as the dot-com bubble unwound. Today, valuation spreads among microcaps are 24% wider than their historical average.
Figure 4: Valuation Spreads Over Time (Spread = Value P/B Divided by Growth P/B)
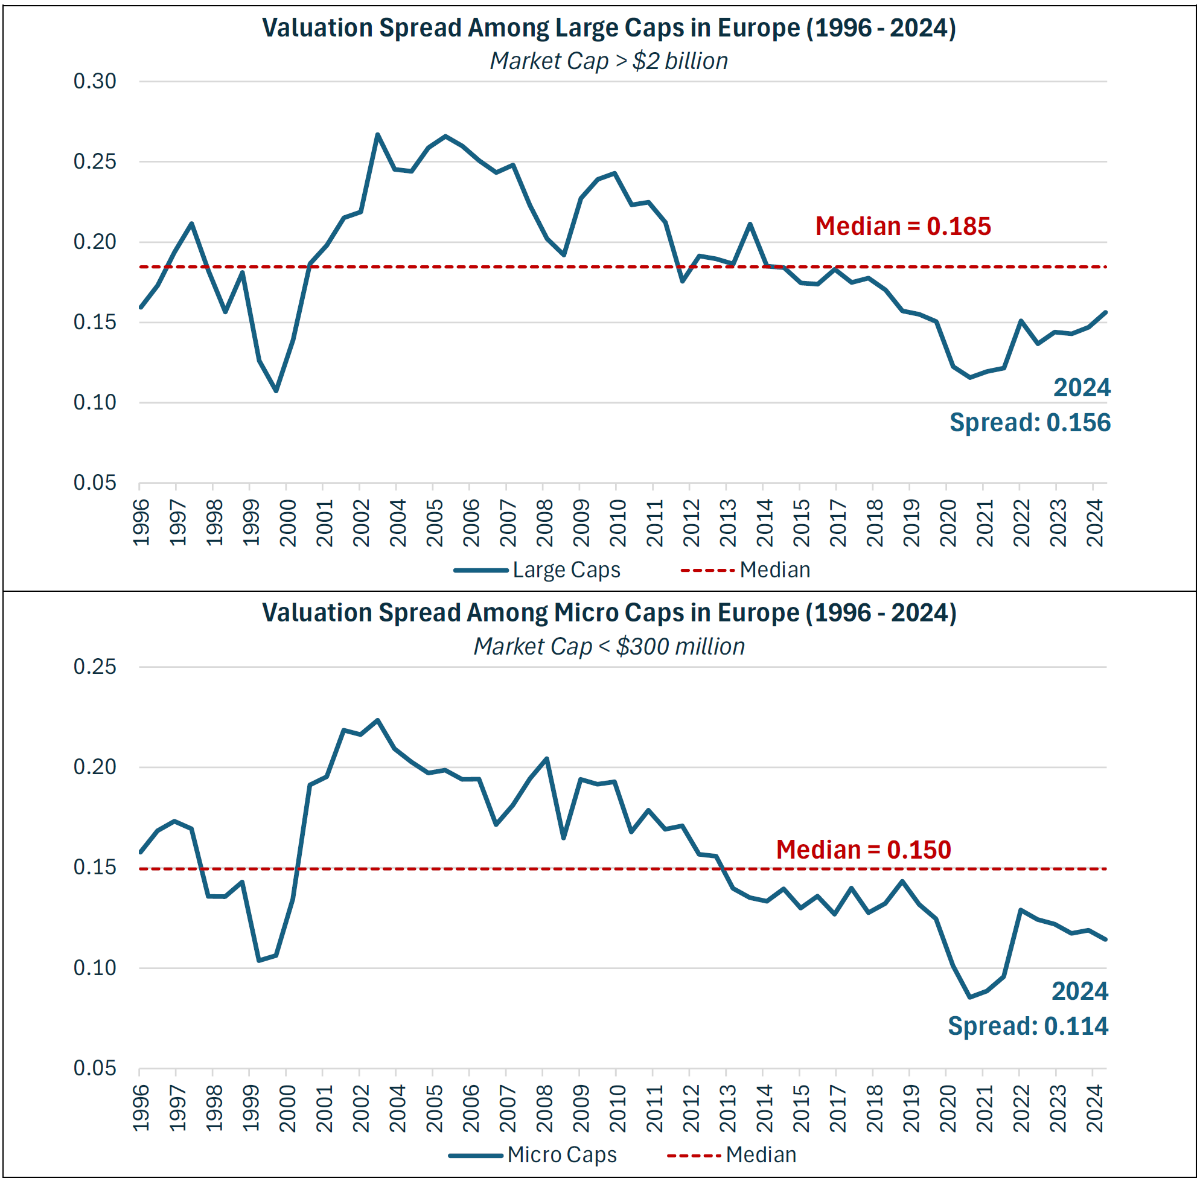
Source: S&P Capital IQ
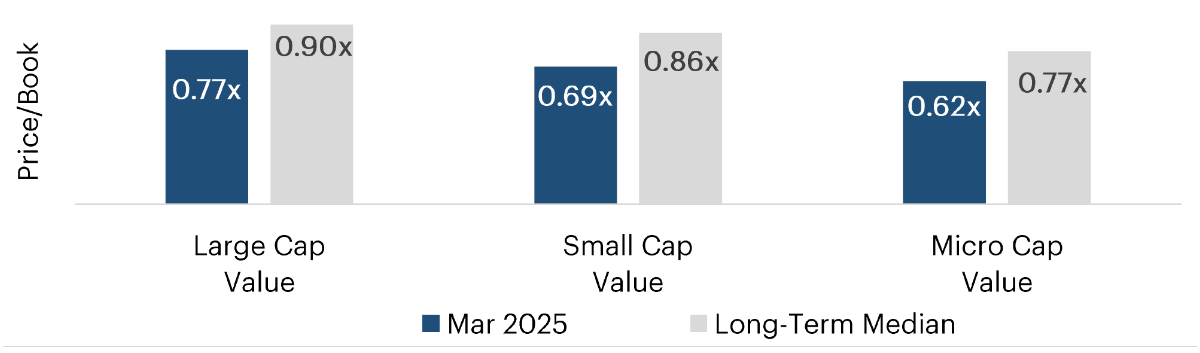
We believe the value opportunity in Europe remains attractive, especially among microcaps. Across size categories, value stocks in Europe trade at lower valuations today compared to their own long-term history. Yet the discounts are deeper among smaller firms. Whereas large value firms currently trade at a 14% discount relative to their own history, small value and microcap value firms trade at a 20% discount to their own long-term history. In addition to offering deep discounts relative to history, microcap value firms also trade at the cheapest absolute valuations in Europe, at 0.62x Price/Book on average today.
Figure 5: Price/Book Valuations in March 2025 Relative to Long-Term History (1996 – 2025)
Source: S&P Capital IQ
With Europe’s microcap value stocks trading at 0.6x Price/Book today, we believe there is significant upside potential as fund flows continue to trickle down to the less liquid corners of the European market. These stocks also offer dividend yields north of 4%, so investors can be rewarded while they wait for mean reversion.