The Golden Tree of Life
Rebuilding factor models for biotech
By: Greg Obenshain, Daniel Rasmussen, and Anton Wintner, M.D.
This is the fourth installment of our series on biotech. To read the full white paper, click here.
I have studied now Philosophy … and here I am, poor fool, no wiser than before.
—Goethe, Faust
Across most industries, quantitative investors rely on three durable factors: quality, value, and momentum. High-quality firms tend to outperform, cheap firms tend to outperform, and returns tend to trend. Importantly, these factors are largely independent—each adds information even after accounting for the others. A stock’s cheapness matters even when comparing companies of similar quality and momentum.
But what happens when the traditional definitions of these factors simply don’t apply? In biotech, the usual anchors dissolve. “Quality” is typically measured using gross profits; “value” is usually measured using profits relative to enterprise value. Both require profits. Most biotech companies, of course, have none.
To build factor models that work in biotech, we need biotech-specific definitions. Fortunately, one of the pillars—momentum—survives. Traditional momentum does not work here, but with a modest re-engineering we showed earlier that similarity momentum does.
Value is the next challenge. Here, the traditional metric fails even more spectacularly. Below we show what happens when we naïvely apply the standard value factor to the biotech universe. Quintile 1 contains the most expensive stocks and should do the worst; quintile 5 contains the cheapest and should do the best. The opposite occurs.
Figure 11: Biotech Company Returns by Traditional Value Quintiles
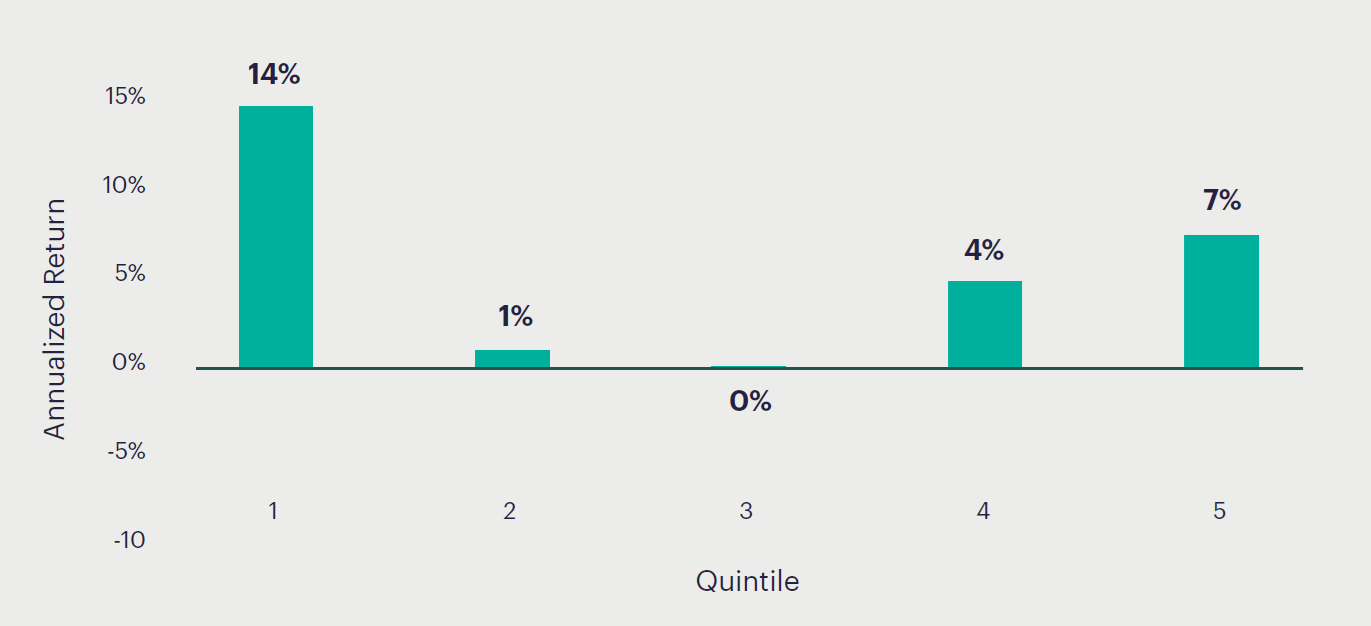
Sources: S&P Capital IQ, Verdad Analysis. September 2013 – October 2025.
The most expensive stocks do the best, and it is hard to argue that there is a pattern in this data.
Faust tells Wagner, “All theory, dear friend, is gray; but the golden tree of life springs ever green.” Nowhere is this clearer than in biotech, where the elegant theoretical framework of traditional value collapses on contact with an industry that has no profits.
The obvious problem is that we are using profit as the anchor for value. We need a better measure of value. In biotech, potential value should have some relationship to the amount a biotech is investing (clinical trials are expensive and are not undertaken lightly). Rather than focusing on negative profits, we could instead measure total spending and use that as an anchor for value. This simple change makes a difference.
Figure 12: Biotech Company Returns by Modified Value Metric Quintiles
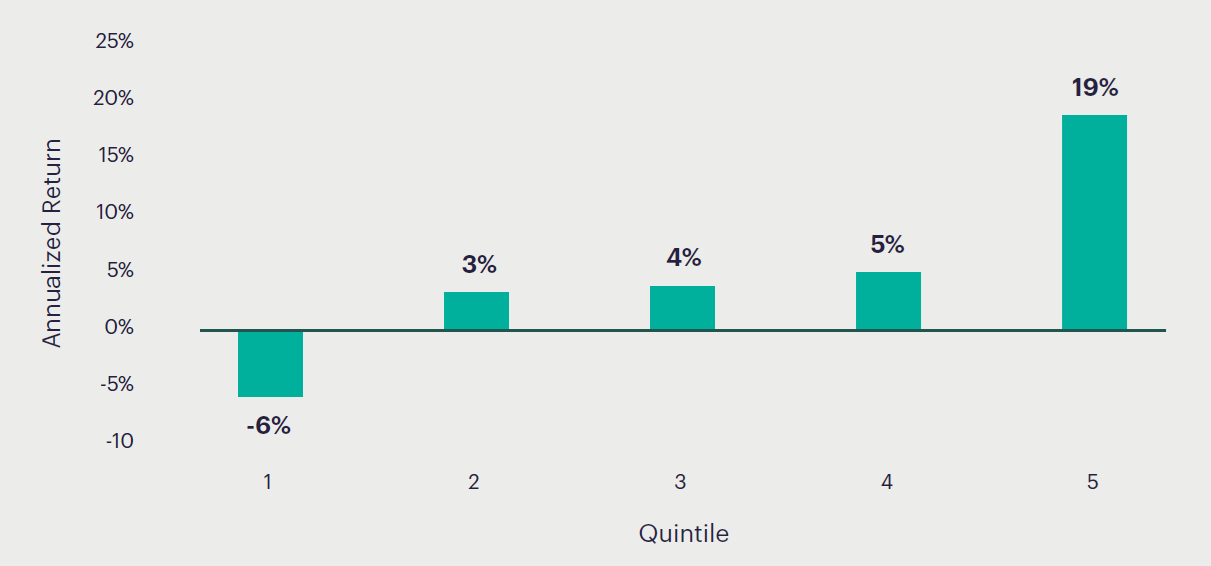
Sources: S&P Capital IQ, Verdad Analysis. September 2013 – October 2025.
Now the value metric works much better than it did before. The value metric shown above also includes some measures of assets and adjusts both assets and enterprise value to exclude cash, but the largest difference comes from changing a nonsensical metric, profits, to a sensible metric, spending.
We now have both a measure of value and a measure of momentum. What remains is a measure of quality, and here we have a very strong candidate: specialists. Specialist consensus—integrating biotech specialist funds, insiders, and short sellers—is nothing if not a verdict on company quality. And it turns out that it is not just a proxy for value. We can verify this by observing that the value and quality metrics spread returns independently. If we divide companies into low, medium and high specialist concentrations, the modified value metric still spreads returns.
Figure 13: Modified Value Metric Within Specialist Concentration Groups
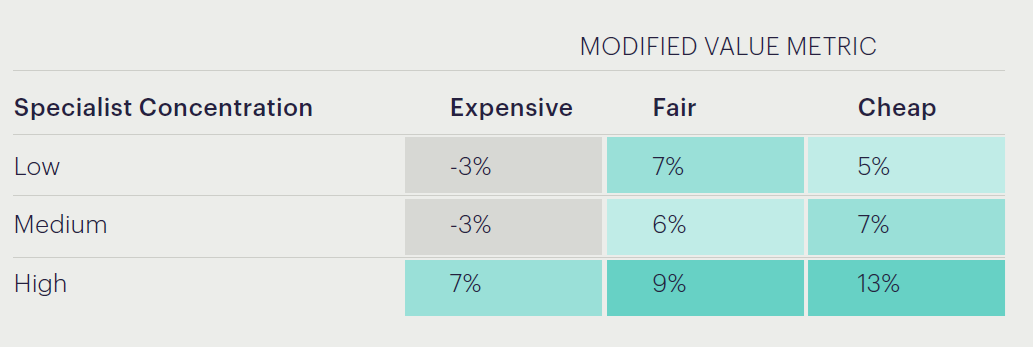
Sources: S&P Capital IQ, Verdad Analysis. September 2013 – October 2025.
The best performing stocks are those that are favored by specialists and are cheap, while the worst performing stocks are the ones that are spurned by specialists and are expensive. These are useful metrics.
Now we have value, quality and momentum metrics for biotech. And we have others that work as well, including trades by insiders and short interest. When we combine all these factors together and use them to estimate forward returns based on their trailing contributions, we find that we now have a factor model that does an excellent job spreading returns.
Figure 14: Blended Factor Return Model
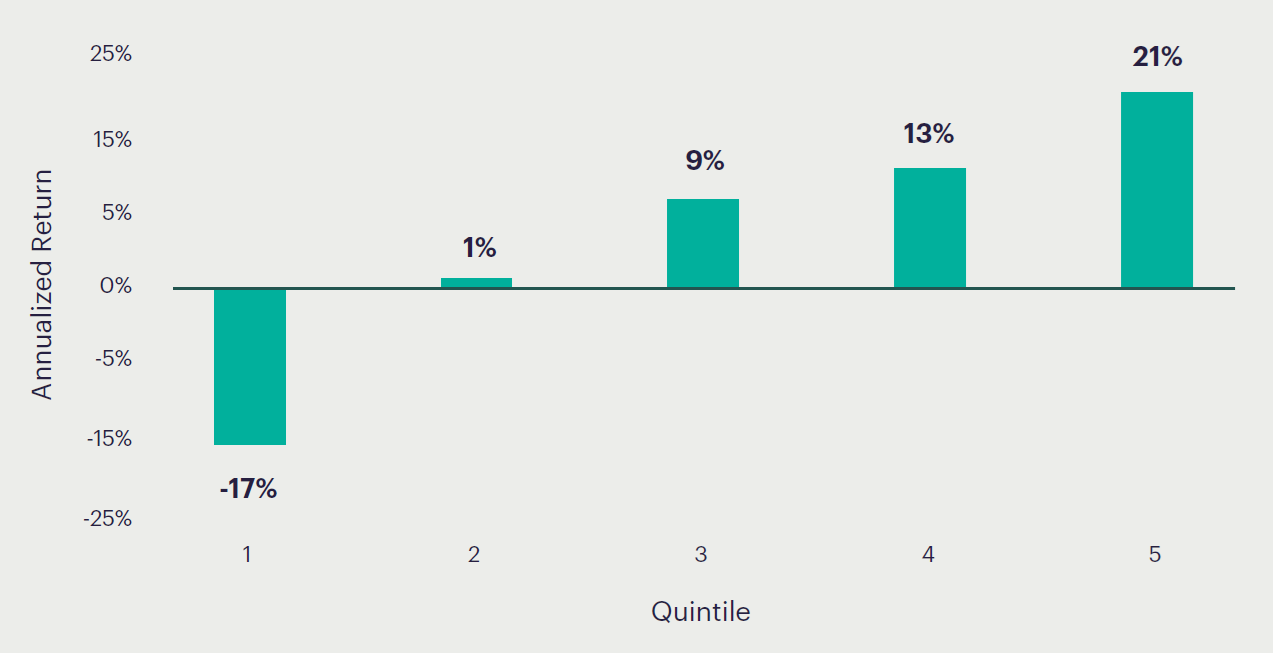
Sources: S&P Capital IQ, Verdad Analysis. September 2013 – October 2025.
The blended model outperforms any single factor, and—most importantly—uncovers opportunities not only to go long the strong but to short the weak. With this foundation in place, we can now ask the practical question: how do we build a portfolio that harnesses these insights in a disciplined, optimized way?
This concludes our serialization of our biotech white paper. For the answer to that question, and the remainder of our paper, click below.