Rule, Britannia!
From ruling the waves to topping the ranks of cheap Western markets.
By: Brian Chingono
Britain’s economy entered a recession at the end of 2023, after two consecutive quarters of declining economic activity. Economic growth for the land of St. Alban clocked in at 0.1% in 2023, compared to 0.5% for the European Union and 2.5% for the United States. The United Kingdom’s economy seems mired in 1970s-style stagnation.
Brexit seems to have been a negative inflection point for the island nation. Using a difference-in-differences technique, we compared the UK’s corporate earnings to Europe’s corporate earnings in the three years prior to the finalization of the UK’s separation from the European Union (12/31/2020) and the three years after. Any meaningful changes in the UK-Europe earnings spread during the post-Brexit period could be attributed to the separation agreement because common shocks like a global pandemic or spiraling inflation would affect both markets concurrently.
In the table below, margin spreads are defined as UK profit margins minus European profit margins, and valuation spreads are measured as UK Price/Book minus European Price/Book. To isolate the Brexit effect on domestic economies, the analysis is based on small-cap companies in both regions, since small-cap firms primarily generate earnings in their domestic markets.
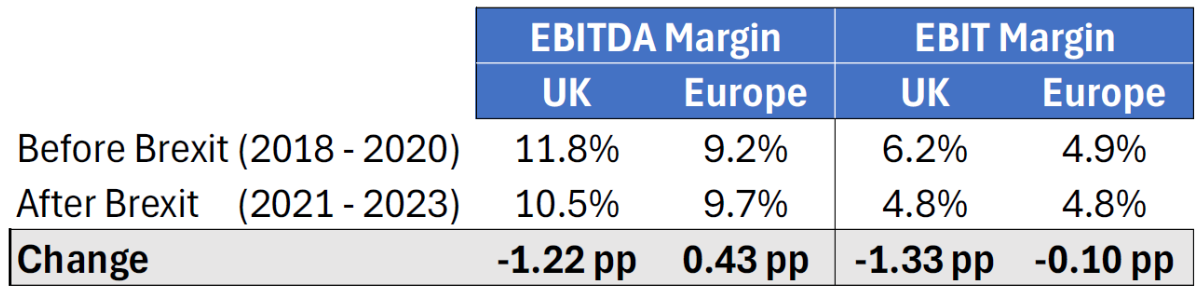
Companies in the UK used to earn higher profit margins—and trade at higher valuations—than companies in continental Europe. But, post-Brexit, the spread in margins has almost entirely disappeared, and UK stocks now trade at a discount, as shown in the table below.
Figure 1: Brexit Effect, as Measured by Change in Margin Spread and Valuation Spread

Source: S&P Capital IQ and Verdad analysis. Small caps are defined as firms above $25M of market cap and below the 80th percentile of market cap (~$2.5B) within each year.
Profit margins have compressed meaningfully in the UK, post-Brexit, whereas European margins have been broadly flat.
Figure 2: Small-Cap Profit Margins in the UK and Continental Europe
Source: S&P Capital IQ and Verdad analysis. Small caps are defined as firms above $25M of market cap and below the 80th percentile of market cap (~$2.5B) within each year.
Investors have sold UK equities as fundamentals have deteriorated. Morningstar estimates that equity funds domiciled in the UK have experienced net outflows in six out of the past eight years, most recently recording 12 consecutive months of net outflows in 2023.
Figure 3: Net Fund Flows in Billions for UK-Domiciled Equity Funds (January 2024)

Source: Morningstar.
While it’s important to note that the fund flow estimates from Morningstar include a wide range of UK-domiciled funds, from international strategies to domestic strategies, we believe the big picture is that UK equity funds have bled assets since the Brexit referendum, leading to the deeply discounted valuations we see today among UK small caps.
The impact on valuations has been significant, with multiples contracting significantly in the UK on an absolute basis and relative to Europe.
Figure 4: Price/Book Valuations in the UK and Continental Europe

Source: S&P Capital IQ and Verdad analysis. Small caps are defined as firms above $25M of market cap and below the 80th percentile of market cap (~$2.5B) within each year.
Today, small caps in the UK trade at a significant discount to continental Europe and the US. Since small caps are primarily domestic operations, we believe the small-cap valuations below reflect investors’ opinion of the relative growth prospects in each region.
Figure 5: Small-Cap Valuations Across Regions (February 2024)

Source: Dimensional Fund Advisors and Morningstar. Based on regional small-cap mutual funds (DFUKX for the UK, DFCSX for continental Europe, and DFSTX for the US).
At a 10.4x P/E valuation today, small caps in the UK trade at a 10% discount to their counterparts in continental Europe, and a 25% discount to their peers in the US. Another way of looking at this divergence would be to observe that, in order to buy UK small caps, investors need to be enticed with higher dividend yields to make up for the lower expected earnings growth in Britain. Today, dividend yields among UK small caps are 25bps higher than continental Europe and a staggering 2.5x higher than the US.
So money has flowed out of the UK and valuations have come down. But is the market getting it right, or has the carnage been overdone?
As we have written before, we think there is a strong case to be made for upward mean-reversion in Europe’s small value multiples, as the cheapest stocks currently trade at the widest discount relative to growth stocks since records began in 1975. We think a long-term bet on upward mean reversion for Europe should also include a cap-weighted allocation to the UK because discounts are greater in Britain. UK stocks represent around 24% of aggregate tickers in the combined investment opportunity sets of the UK and Europe. Therefore, we think a good baseline for UK exposure would be around a quarter of investors’ aggregate allocation to European stocks, and up to a third for those pursuing deep value.
With the UK’s valuation premium turning into a discount, it appears the bad news around Brexit has already been priced in. In our opinion, what’s not priced in are the potential levers for upside in the UK going forward. For example, with UK small caps trading at a 25% discount to the US in terms of P/E and generating enough cash flow to offer dividend yields that are 2.5x higher than the US, it seems the UK small-cap market is ripe for private equity firms that are sitting on a record $2.6 trillion of dry powder. In 2022 and 2023 there were over 27 acquisitions of companies in the UK’s Numis Smaller Companies Index, and half of these firms were taken private by PE acquirers. The median acquisition premium was 51% among all of these transactions, and the 2023 deals were done at an estimated purchase multiple of 11.5x EV/EBITDA. For private equity, this compares favorably against the average US purchase multiple of 15.7x EV/EBITDA. Simply put, today’s discounted valuations of UK small caps provide enough room for a healthy acquisition premium of 51% while still offering better relative valuations for private equity acquirers.
Most recently, one of Britain’s leading electronics retailers, Currys, is the subject of a potential bidding contest between Elliot Advisors and JD.com, an online retailer. Even after Currys’ shares jumped 47% over the three days between February 19 and 21, the small-cap stock with £730 million of market cap is trading at cheap valuations of 4.7x EV/EBITDA and 0.4x Price/Book.
We believe this example, and others much like it, illustrates that, with the Barbarians at the Gate, valuations in the land of Admiral Nelson may yet rise again.
And with British voters having another opportunity to chart their nation’s course at the next general election within the next 12 months, we wish them success in their cause for freedom and broad prosperity. May they not cease from mental fight, nor may their sword sleep in their hand, till they have built Jerusalem in England’s green and pleasant land!