A Momentum Crash Course
High-yield spreads can predict crashes in long-short momentum portfolios
The classic momentum strategy of buying winners and selling losers has an Achilles heel: infrequent but extreme crashes.
In 2009, for example, a strategy long top-decile momentum stocks and short bottom-decile momentum stocks would have experienced a whopping 65% crash as stocks rebounded out of the financial crisis. We saw a similar, though less extreme, crash in late 2002 as markets recovered from the dot-com bubble.
The chart below compares the performance of a long/short (L/S) momentum portfolio to the global equity market, with momentum crashes highlighted. The momentum L/S portfolio outperforms the market portfolio from 1996 to 2008 but loses its cumulative edge as it loses over half of its value during the 2009 market rebound.
Figure 1: Cumulative Log Returns of L/S Momentum vs Global Equity Market
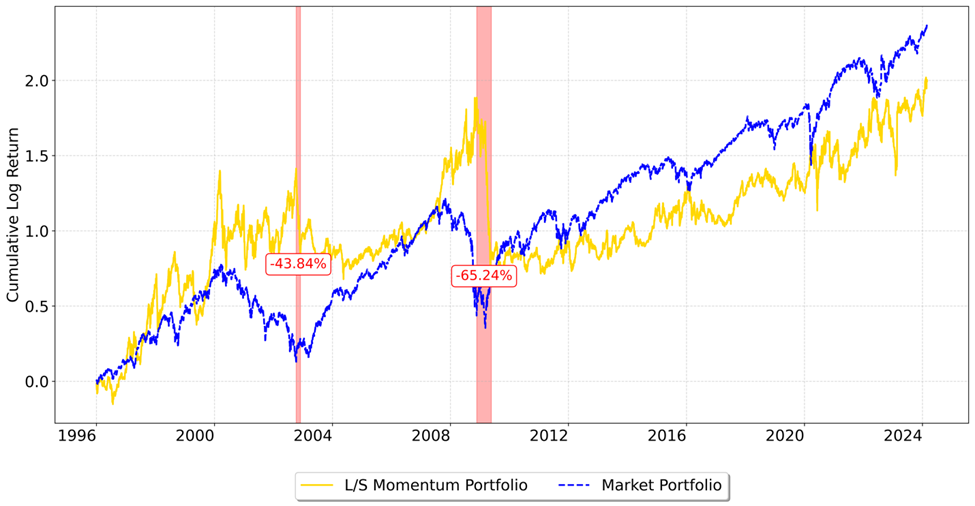
Source: Verdad analysis, Capital IQ
The underperformance of the momentum L/S strategy during these crashes can be attributed to significant mean reversion during market rebounds, what some researchers describe as loser portfolios “crashing upwards.” As markets rally, past losers tend to revert more strongly than past winners do, leading to a “zero to hero” moment for the loser portfolios. The momentum L/S strategy has done exceedingly well during recessionary times, returning 22% versus the market’s -41% in 2008. However, momentum crashes during market rebounds can erase this outperformance entirely. The momentum L/S portfolio drew down 55% in 2009 as the market rallied 36%.
But what if investors could identify these market inflection points and adjust momentum exposures accordingly? We believe the high-yield spread has potential to help investors dodge these momentum crashes.
There is a strong relationship between the level of high-yield spreads and the one-month returns to the momentum factor. Specifically, tight high-yield spreads are associated with robust momentum premia, while elevated spreads (400-700 basis points) predict weaker returns. The right signal to move out of the momentum strategy—or even to initiate strong bets on reversals—has historically been when spreads exceed 700 basis points.
Figure 2: Average FWD 1M Returns to a Momentum L/S Strategy by HY Spread Level

Source: Verdad analysis, Capital IQ
Interestingly, the high-yield spread is not a particularly useful predictor of the forward returns of the “winner” portfolio. Rather, it significantly predicts momentum crashes by identifying when the “loser” portfolios will experience positive reversals. This is consistent with our research on the increased predictability of returns during crises.
Using the high-yield spread to predict momentum crashes complements the findings of Daniel and Moskowitz (2016), who found that momentum crashes are forecastable, occurring "following market declines and when market volatility is high … contemporaneous with market rebounds."
High-yield spreads offer investors a valuable tool to discern when to sail with the market winds and when to tactically change course and steer clear of impending momentum crashes. We believe momentum investors can use the high-yield spread to harvest long-term momentum premia while navigating market volatility and minimizing drawdowns.