Japan's Orphans
What small shifts in Japan’s cash savings rate might mean after a decade where public equities became a bit less public there.
By: Verdad Research
Japan is unique among major developed equity markets in our opinion. Almost half of the listed stocks on the world’s second largest stock exchange still trade below book value (44%), and there are over 600 deep-value stocks that trade at half of book value or less. Almost all of those deep-value stocks are small-caps or micro-caps (93%) as we highlighted a few weeks ago. In our opinion, there’s still an allure in Japan for old-school deep value investors looking to build a portfolio at a fraction of the purchase price one would have to pay in the US these days.
But a skeptic might well ask the obvious question: are these value traps? Someone, after all, needs to come in to buy these stocks to drive the valuations up, and if there were one area of the market that investors might overlook, Japanese micro-caps seem a prime candidate.
Japanese micro-caps have been very cheap for years. So we first need to contextualize the question of “who is the incremental buyer” with the history of how stocks like this have traded over the last 20 years.
Here we get a surprising result: consistently holding the most orphaned stocks in Japan has compounded at higher rates than the broader Japanese market, even in the last 25 years, when the Japanese market as a whole was being orphaned until last year.
Figure 1: CAGRs for Japanese Academic Deep Value vs. Higher-Capacity Alternatives, 2000–2024
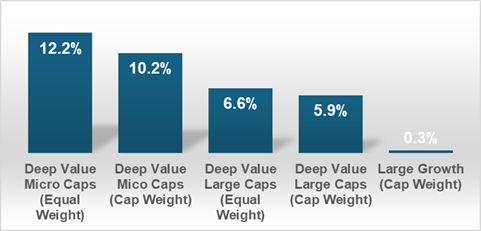
Source: Ken French website (5x5 returns on Size and Book-to-Market Quintiles)
Abandoned, deep-value micro-caps found sufficient buyers to produce a sizable premium over other strategies, even when the size premium only worked 50% of the time and liquidity levels and relative valuations for Japan were falling. All major developed geographies saw similar directional results during this period. There is an identical directional trend even if we start and end with the large growth rallies of the ’90s and 2010s.
But we believe there’s a reasonable possibility that a more significant influx of buyers into the Japanese market might lead to an opportunity similar to the NASDAQ in the 2010s.
The single biggest potential incremental buyers for deep-value micro-caps are individual Japanese investors. These investors today dominate the ownership of most micro-caps, with “public or other” owning 65% of the shares of deep-value micro-caps according to Compustat. And there’s room for these investors to buy significantly more. The Japanese public, despite having the second largest stock exchange in the world and the third highest per-capita household net wealth levels in the G20 (behind only the US and Canada) have only put ~10% of that wealth into stocks, far behind the 39% for US individuals today, according to OECD data. But, before the 1980s, Japanese individuals owned nearly 40% of their own stock market, according to the Tokyo Stock Exchange.
Much has been made in the last year or two about the record-setting buybacks Japanese companies have been performing with their notorious cash hordes and newfound profitability, but the $5.2 trillion of corporate dry powder that has been slowly making its way into Japanese stocks of late pales in comparison to the $19.7 trillion Japanese citizens are sitting on. A 1% shift of the Japanese cash savings rate into the Japanese stock market would be about $200 billion, which is almost 10x more than the $24 billion foreigners poured into Japanese stocks last year.
Just last month the government opened its revamped NISA plans, which allow Japanese people to invest in stocks and mutual funds with tax advantages. Now the contribution limits are doubled, and tax exemption is permanent now on both individual stocks (previously 5 years) and mutual funds (previously 20 years). It’s early, but the early results are encouraging:
“Applications to open new NISA accounts have doubled from a year earlier, and administrative processes are ‘barely keeping up,’ said Tomoichiro Kubota, senior market analyst at Matsui Securities.”
It seems plausible to us this could put small dollars into small stocks by locals who don’t need an English translation of a sell-side report to hit buy on the few large caps that provide them. When NISA was originally introduced in its scaled-back form in 2014, Japanese household investments in stocks rose from 9% to 12% by 2017. Another 5% shift would be about $1T, which is enough cash to buy out over 90% of listed stocks in Japan at their current market caps (all but the largest 300).
It's very hard to prove this hypothesis out though because during the 10 years of high frequency fund flow data we have from the Japanese exchange, individuals were net-sellers for almost the entire period.
We scraped the data from their monthly reports, and below we show net fund flows for each market participant into Japanese equities since 2013. The counterparty for all net buying by a particular group can be roughly inferred from the contemporaneous seller (the other side of the x axis).
Figure 2: Net Value of Buying (Selling) over Time (Trailing LTM)

Source: Monthly total traded value reports on TSE PRIME by the Japan Exchange Group. We exclude security companies here as they are immaterial.
Individuals were never major buyers of Japanese stocks over the last decade, so we just don’t have any recent precedent for that kind of scenario.
However, other market participants oscillated between buying and selling much more dramatically. After the early Abenomics years, the net selling by foreigners had been significant for over 10 years before a small resurgence in the last 12 months. Did these flows impact the performance of smaller stocks?
We analyzed the relationship between net flows and about all we found was that large-scale inbound foreign fund flows were highly correlated with the market premium in Japan. Generally, the overall stock market went up while foreigners were buying. But there was near zero correlation between foreign fund flows (or any group) and the size premium, meaning that there is no evidence to suggest that foreign flows go disproportionately to large caps or small caps.
Figure 3: LTM Net Foreign Fund Flows and the Size Premium

Source: Ken French library for the 5-factor size premium.
At times, foreign investors’ capital inflows appeared to be more beneficial to the pricing of smaller companies (as it was during the early Abenomics years). At other times it appeared to drive up the prices of larger companies (as it did last year).
The only interesting exception to this was on very short-term data. Despite the recent aggregate amount of foreign fund flows being so much smaller than during Abenomics, in Q2 of last year foreigners deployed capital into Japanese equities at the fastest pace they ever have (i.e., it was a rush). As they did this, large stocks outperformed small stocks by about 7% in that quarter. Historically, most of the time when foreign capital was deployed quickly into the Japanese market, large caps got a temporary bump. The correlation goes even higher if we look at monthly data for the velocity of inbound foreign fund flows.
From a predictive standpoint, this suggests to us that a portion of the premium received by large caps in Japan last year as they ran up in price twice as fast as smaller companies was speculative rather than fundamental. We found no evidence supporting any difference in fundamentals that would otherwise explain the divergence last year. Quite the opposite.
It's not for lack of trying that we can’t mathematically demonstrate where precisely fund flows will go on short horizons. But perhaps that’s encouraging, especially when combined with current prices and some of the recent developments that may make the next decade look a bit less like the last decade on factor performance.