Opposing Ideas
A necessary ingredient for a diversified portfolio
F. Scott Fitzgerald famously wrote, “The test of a first-rate intelligence is the ability to hold two opposing ideas in the mind at the same time, and still retain the ability to function.”
It’s an aphorism that more portfolio managers should have framed in their offices. Get too enamored with one idea, one way of thinking, and a portfolio becomes nothing more than a single, correlated bet, fragile to the next paradigm shift.
These single-idea portfolios are all too common. Think of the QQQ and bitcoin tech optimists. Think of the consultant-advised "long-term investor" with 40% in privates and the remainder in concentrated public equity funds.
But the two best-performing major styles of public equity investing over the last five years have nothing in common. In fact, they are completely opposing ideas. The chart below shows the total returns of the major indices and style-box strategies over the trailing five years. The winners? Large-cap US growth and … international small-cap value.
Figure 1: 5Y Total Return CAGR for Major Indices through Sept. 30, 2025
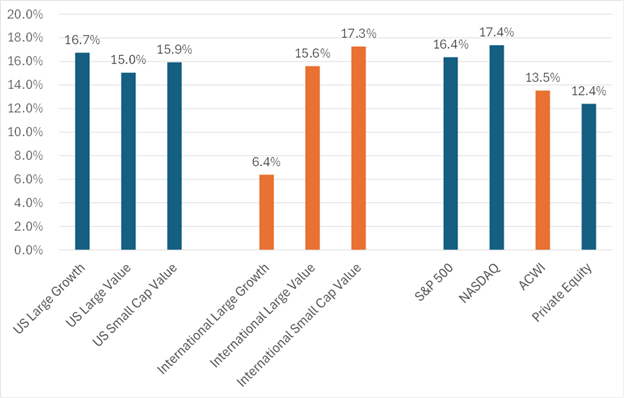
Sources: S&P Capital IQ, Verdad analysis. Note: Each data series represents the following public listings: US Large Growth (ARCA:VUG), US Large Value (ARCA:VTV), International Large Growth (BATS:EFG), International Large Value (BATS:EFV), International Small Value (ARCA:AVDV), US Small Value (ARCA:VBR), S&P 500 (ARCA:SPY), NASDAQ (NASDAQGM:QQQ), ACWI (NASDAQGM:ACWI), and Private Equity (LSE:HVPE).
If you run a quick solver in Excel on these historical outcomes, the return-maximizing allocation five years ago (with perfect foresight) would have been 53% to the NASDAQ and 47% to international small-cap value. A barbell approach to be sure.
In addition to absolute returns, investors also should care about risk. And international small-cap value has been less volatile than the NASDAQ (or US small-cap value).
Figure 2. 5Y CAGR and Volatility of Global Indices (Sept. 2020 – Sept. 2025)
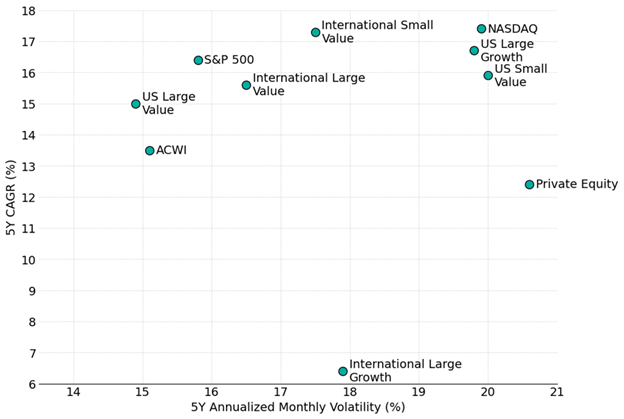
Sources: S&P Capital IQ, Verdad analysis. Each data series corresponds to the same public listings shown in Figure 1.
Correlations matter too. Here we see international value shine again. Over this period, international large- and small-cap value categories have delivered returns comparable to US markets while exhibiting relatively low correlation with the S&P 500.
Figure 3. 5Y CAGR and Correlation to S&P 500 (Sept. 2020 – Sept. 2025)
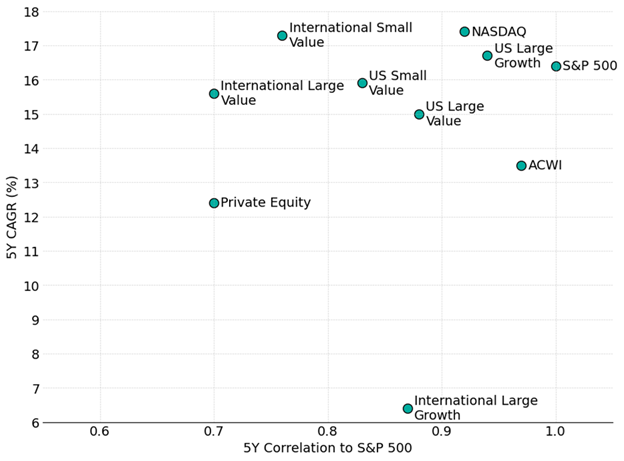
Sources: S&P Capital IQ, Verdad analysis. Notes: Correlations are based on monthly returns in USD. Each data series corresponds to the same public listings shown in Figure 1.
We believe the case for international diversification is underpinned by wide valuation spreads between the US and international markets. Over the past three decades, developed international markets have traded at a 31% discount relative to the US, on average, as measured by price-to-book (P/B) spreads. Today, that spread has almost doubled to a 56% discount among international markets, relative to the US. This spread is near a three-decade record and remains close to extremes that were reached in 2020, according to data from Ken French’s data library. A potential narrowing of this spread would benefit international market returns relative to the US going forward.
Figure 4: P/B Spread, Measured as International Developed Market Divided by US Market (1993–2025)
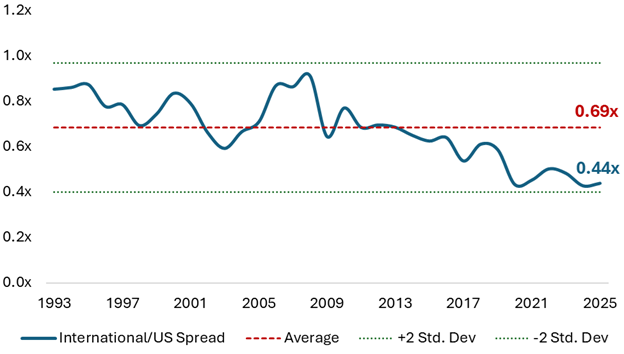
Sources: S&P Capital IQ and Verdad research
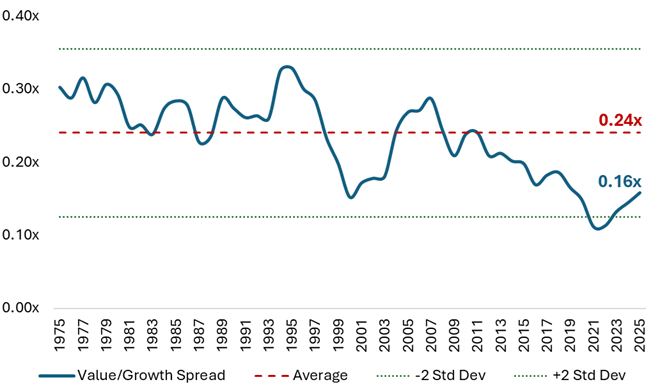
In addition to a potential narrowing of historically wide geographic spreads, we believe there is additional upside potential among value stocks that are located abroad. Today, valuation spreads within international markets are far from their historical average and are currently about as extreme as during the 2000 dot-com bubble, as shown in the figure below. We believe this implies more potential upside from mean reversion among international value stocks. Since small value firms trade more cheaply than large value firms, we believe the greatest upside potential from mean reversion is among international firms that are both small and cheap.
Figure 5: International Value/Growth Spread (1993–2025)
Sources: S&P Capital IQ and Verdad research
International small value, in particular, stands out as a rare combination of high returns, moderate volatility, and low correlation to US equities—an especially valuable mix for investors seeking true diversification. Using this data set, the Sharpe-optimal mix of these equity strategies over the trailing five years (again, with perfect foresight) would have been 35% US large value, 29% NASDAQ, 19% international small-cap value, and 17% international large-cap value.
Optimizing risk-adjusted returns (i.e., Sharpe ratio) in an equity portfolio over the last five years would have required a much larger allocation to international small-cap value than might be expected from such a niche asset class.
We believe that’s a solid opposing idea to hold in your mind. But it is one few investors have embraced.