Where Factors Speak Loudest
Size modulates factor potency in global equities
The “size effect” entered the academic lexicon with Rolf Banz’s 1981 observation that smaller firms tended to outperform larger ones. Eugene Fama and Kenneth French (1992) cemented the idea in their seminal three-factor model, one of the first systematic challenges to the CAPM. The model embedded what became known as the “small-cap premium”: the tendency of small stocks to deliver higher average returns than large stocks.
Subsequent research, however, complicated the story. Fama and French’s own 2012 global update, along with Hou, Xue, and Zhang’s q-factor model, showed that, once you control for characteristics like investment and profitability, the size premium largely vanishes. In the decades since, “size” on its own has proven elusive as a persistent source of excess return.
Still, we believe size matters—not as a standalone source of return, but as a modulator of other factors. In our research, we have found factor premia are strongest in microcaps and fade gradually as market cap increases. Small size amplifies factors, while large caps dilute them.
One way we can show this effect is to run classic Fama-French long/short portfolio sorts within size-sorted subsets of the global equity universe. We divided a universe of around 10K global equities into deciles by market cap, from microcaps (decile 1) through mega caps (decile 10). Within each size decile, we formed simple long/short factor portfolios for value, profitability, and earnings volatility.
Figure 1: Annualized L/S Factor Premia by Market Cap Decile
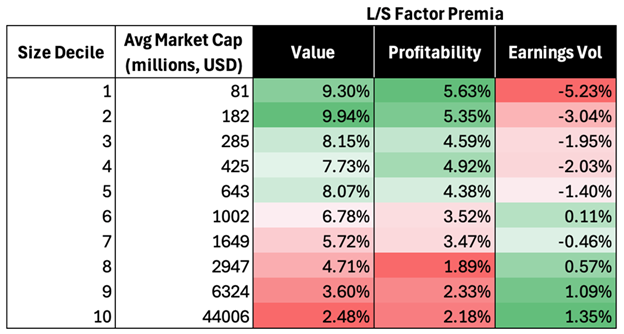
Source: Global Equity Universe, 1996-2025. Note: Fama-French portfolios are formed within each size group by going long the top factor decile and short the bottom factor decile. Factor returns are aggregated monthly but annualized in the table above.
Factor performance appears to be strongest in small and microcap universes, and more muted in large and mega caps. For value, cheap companies outperform expensive companies by nearly 10% per year in microcap land, whereas the premium is closer to 2-3% in large caps. Similarly, profitable companies outperform unprofitable across size deciles, but the magnitude of outperformance is more than twice as powerful in the smallest decile compared to the largest (5.6% vs. 2.2%). Earnings volatility goes one step further: its sign flips from negative in microcaps to positive in the largest caps. Small companies with volatile earnings tend to exhibit negative returns, while larger companies with volatile earnings have exhibited positive returns compared to their less volatile peers.
Another way to see the “watering down” effect of large caps is to compare different weighting schemes in a cross-sectional regression framework, sometimes referred to as Fama-MacBeth regressions. This enables us to assess factor premia after controlling for coincident factor exposures. Coefficients from these regressions yield factor premia associated with being exposed to each style factor (specifically one standard deviation more exposed than the market as a whole).
In the table below, market-cap weighting gives more weight to large caps, while equal-weighted regression tilts more heavily toward smaller companies, and square-root weighting falls in between.
Figure 2: Factor Sharpe Ratios Across Weighting Schemes
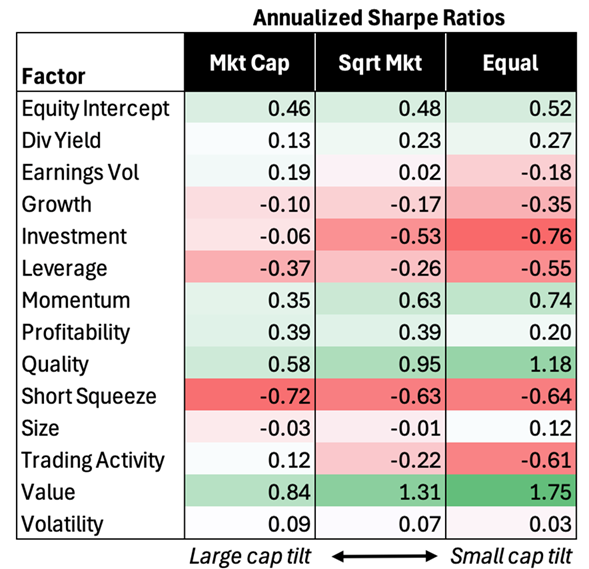
Source: Verdad analysis. Note: Factor returns are generated via cross-sectional regressions of fundamental factor exposure (z-scored -3 to 3) against forward 30-day local excess returns. Universe of 11K global equities (as of 2025). Premia aggregated from 1996 to 2025. Region and sector binary flags were included as controls in each weighting scheme.
Equal-weight regressions, which tilt most heavily toward smaller firms, show consistently stronger factor Sharpe ratios. Market cap–weighted regressions, by contrast, show weaker premia across almost every factor. The dilution is especially striking for value, quality, and momentum—three of the most well-established factors.
Of course, stronger premia in small caps do not translate directly into investable returns. Thin liquidity, wider spreads, and higher trading costs can erode much of the apparent factor premia, especially for more active strategies. Large caps, by contrast, come with lower costs and greater scalability, but more muted factor premia.
In our view, size is less a standalone source of return than an amplifier that determines how loudly factors speak.