Hope Springs Eternal
After more than a decade of drought, the value premium has sprung back into positive territory, and the best years may be yet to come.
By: Brian Chingono
Hope is classically defined as the patient, confident expectation of a good future. The attainment of this good future is often subject to forces beyond our control, requiring us to actively choose to practice patience in the present. Hence, the virtue of hope is more than just optimism.
Over the 14 years between January 2007 and December 2020, the value factor experienced a withering famine. During this horizon, value stocks trailed growth firms by -5.7% annualized, according to global data from Ken French. Even though the long-term record for value remained intact at the end of this famine, with a 3.3% value premium since 1926, it took profound patience and confidence to continue hoping for a good future in value by the end of 2020. Yet this patience was handsomely rewarded over the next five years, with value significantly outperforming growth globally, and particularly among international markets, as shown in the chart below.
Figure 1: Five-Year Annualized Value Premium (Jan. 2021 – Dec. 2025)
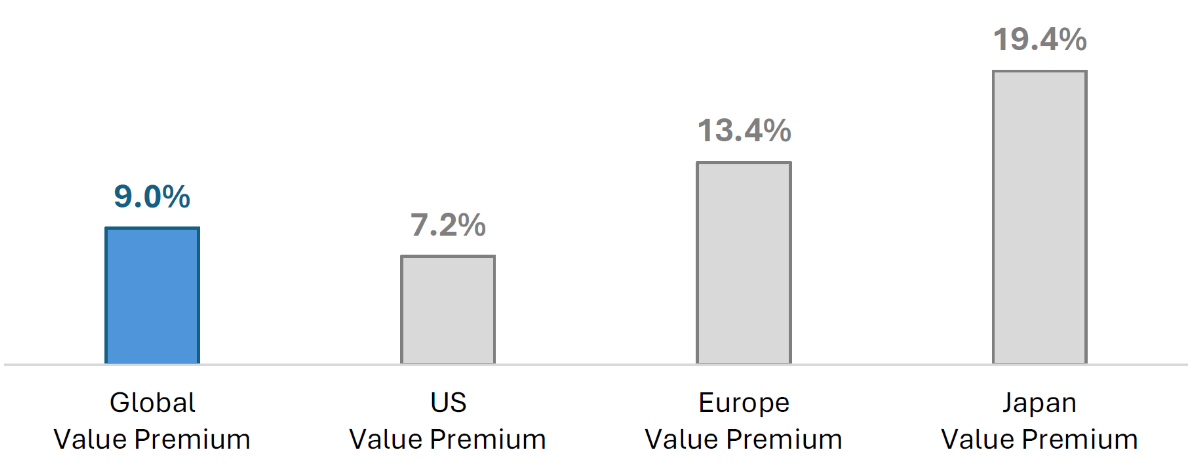
Sources: Ken French data library and Verdad research
Now that a good future for value appears to be dawning, a key question is how long it will last. From today’s standpoint, can we continue to hope for a good future in the value premium?
To answer this question, we can look at the long-term evidence from valuation spreads and forward returns. Valuation spreads tell us how cheaply value stocks are trading relative to growth stocks, and we measure this spread as the Price/Book ratio of value stocks divided by the Price/Book ratio of growth stocks. This effectively gives us the price of value relative to the price of growth. Across all years in our sample, we can map these starting valuation spreads to forward value premiums over the next five years, giving us a direct relationship between valuation spreads at each point in time and return outcomes for the value factor five years into the future. The figure below shows our results for the United States over the past five decades.
Figure 2: US Valuation Spread and Forward 5-Year Value Premium (1975 – 2025)
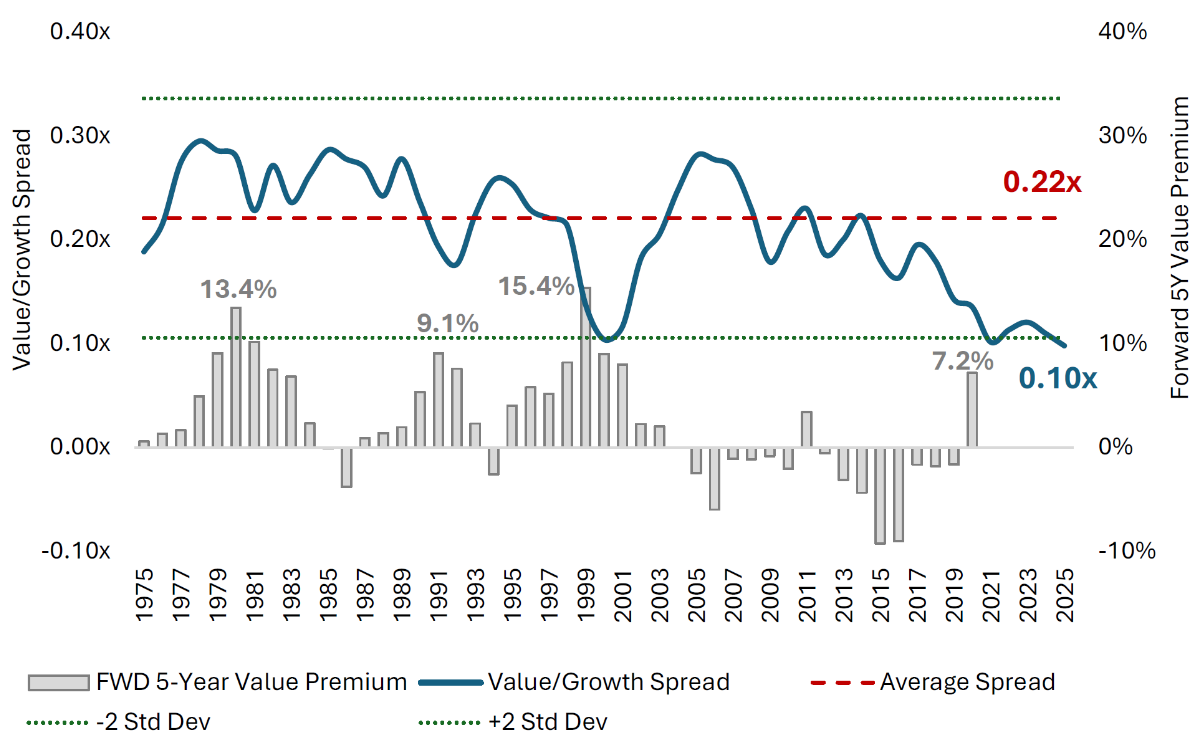
Sources: Ken French data library and Verdad research
On average, US value stocks have traded at a 78% discount (i.e., 22 cents on the dollar) relative to growth stocks over the full five-decade horizon. Yet with the rise of Big Tech in the 2010s, this valuation spread has now widened to historically extreme levels, with value stocks trading at 10 cents on the dollar relative to growth stocks today. This discount is so extreme that even if today’s relative valuation of cheap stocks were to double going forward, we would only be returning to the long-term average valuation spread in the US. Evidently, there seems to be plenty of room for value to run through mean reversion going forward.
Over the full horizon, the five-year forward value premium has averaged 2.3% annualized, even though this sample includes the longest stretch of value underperformance in recorded US history since 1926. In the above bar graph representing five-year forward value premiums, we could think of each year in terms of vintages. Before 2005, the norm was to see long stretches of positive vintage years for the value premium (e.g., 1975–1983, 1987–1993, and 1995–2004) interrupted by short corrections of negative five-year value premiums. Since positive value premiums have historically been clustered in 7- to 10-year windows, it’s plausible to assume that the 7.2% value premium we see most recently is just the beginning of another cluster that could similarly run over a 7- to 10-year window of vintage years.
US valuation spreads today remain as wide as they were at the end of 2020, when value proceeded to outperform growth by 7.2% annualized over five years. Therefore, we believe it’s reasonable for today’s value investors to assume a similar level of outperformance over the next five years. There is also reason to hope that value outperformance over the next five years could be even greater than 7.2% per year because the value premium peaked at 9–15% annualized during previous clusters of positive value premiums.
Since the US value premium has only recently turned positive, with only one positive five-year vintage since the end of the value famine, it may be instructive to look internationally to see whether we find more durable evidence of value’s comeback.
After the great value famine ended around 2019 in Europe, we can see two vintages with positive five-year outcomes for the value premium. Importantly, the second positive vintage (2020) had a bigger five-year value outperformance than the first positive vintage (2019). These successive positive vintages provide more evidence that we may be entering another decade-long cluster of vintages with positive five-year value premiums.
In today’s European market, value stocks trade at 12 cents on the dollar relative to growth firms, compared to an average historical discount of 21 cents on the dollar. Again, we see that a doubling of cheap stocks’ relative valuation would simply revert the spread to its historical average. There seems to be plenty of upside remaining for Europe’s value stocks from multiple expansion, and we also see clearer evidence of mean reversion underway since the end of 2019.
Figure 3: Europe Valuation Spread and Forward 5-Year Value Premium (1975 – 2025)
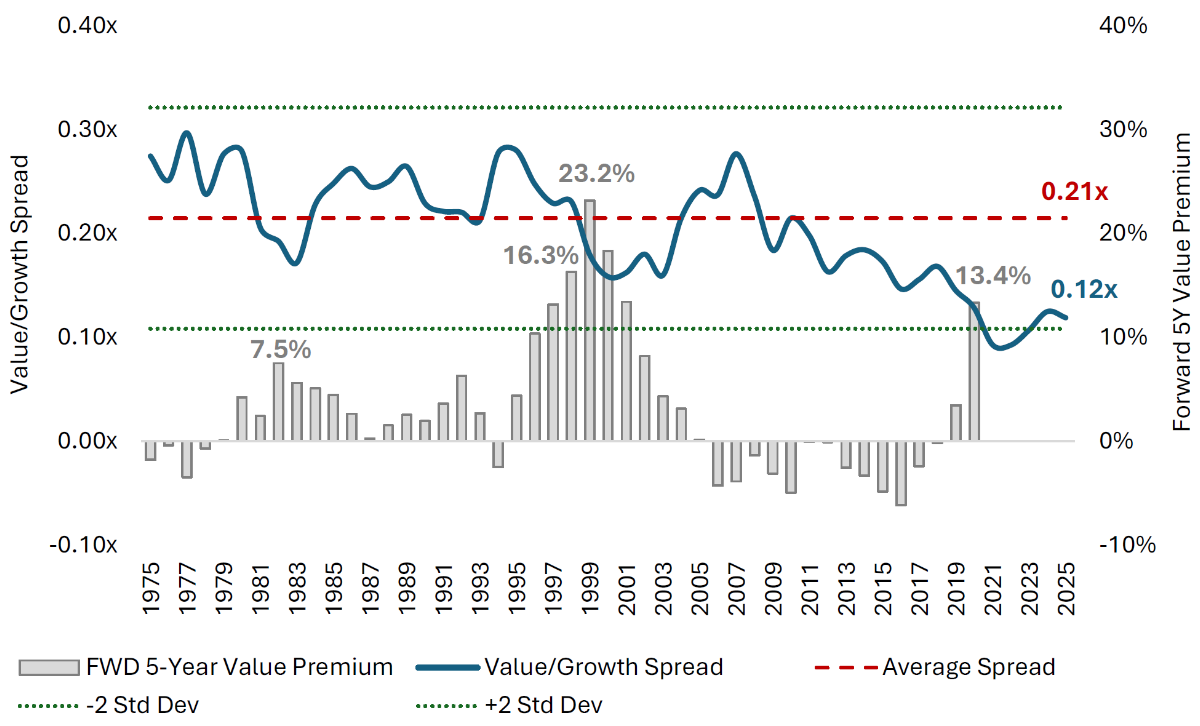
Sources: Ken French data library and Verdad research
In Japan, we see the clearest evidence of a new cluster of positive vintage years after the end of the great value famine. In recent years, we can see three vintages with positive five-year outcomes for the value premium (December 2018, 2019, and 2020). Even after value has outperformed growth by a whopping 19.4% annualized in Japan over the past five years, valuation spreads continue to remain wider today than their long-term history. Specifically, Japan’s value stocks trade at 15 cents on the dollar relative to growth firms today, compared to an average historical discount of 20 cents on the dollar. For context, today’s valuation spread in Japan is similar to the level reached in December 1999 near the peak of the dot-com bubble. Over the five years that followed the dot-com bubble, Japan’s value stocks outperformed growth firms by 21.4% annualized.
Figure 4: Japan Valuation Spread and Forward 5-Year Value Premium (1992 – 2025)
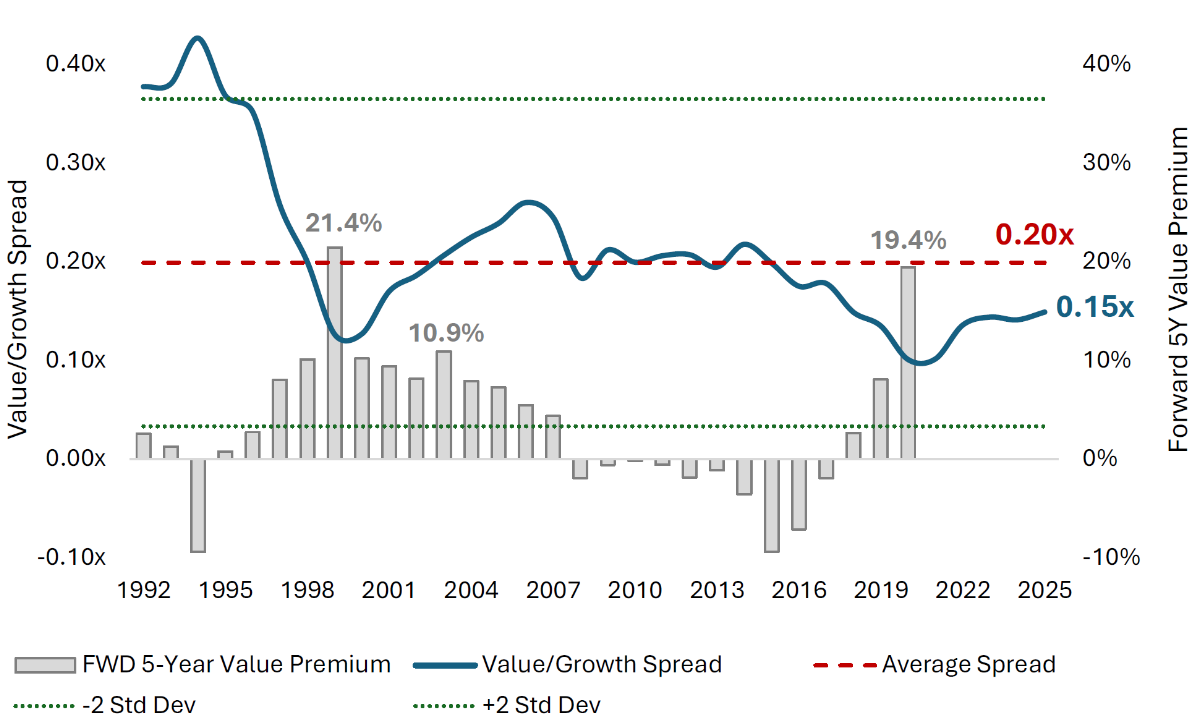
Sources: S&P Capital IQ and Verdad research
In addition to today’s opportunity to buy value at a discount relative to history, we believe the best news for value is visible when we take a long-term view. Over the past five decades, the global value premium has averaged 3.1% annualized, offering robust outperformance to buy-and-hold investors. Hope springs eternal, and it appears that value is best realized over a long horizon.