Distribution of Global Value
Deep value opportunities abound among international markets.
By: Brian Chingono
Last week, we highlighted how global valuation spreads have widened to historical extremes in recent years, providing a compelling setup for value outperformance through mean reversion going forward.
But where should investors focus their attention within global value to maximize their exposure to the opportunity today? Below, we show the results of a simple screen of global developed markets. We filtered for companies that meet three thresholds:
valued at less than 1.0x Price/Book
valued at less than 10x Price/Earnings
market cap greater than $100M
This gave us a count of the liquid value firms within each region of the global developed market. We then appended the sum of market capitalizations and the sum of revenue for these value firms within each region. The table below is ranked by the proportion of revenue attributable to each region.
Figure 1: Distribution of Global Value Opportunities (March 2026)
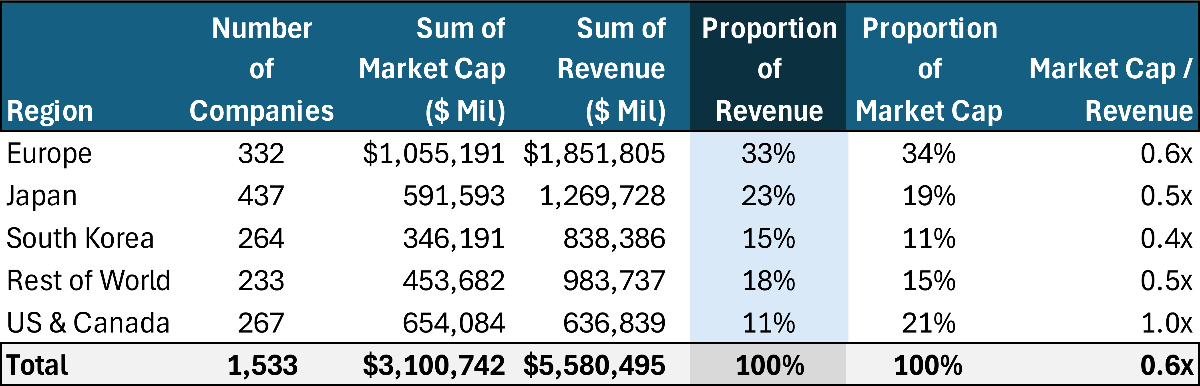
Sources: S&P Capital IQ and Verdad research
There seems to be good reason for investors to orient their value allocations internationally. Around 89% of the value opportunity set by revenue (and 83% by count of companies) is located outside of North America. Europe accounts for about one-third of the global value opportunity set, making it the largest single region for value by revenue or market cap. Approximately another third of the opportunity set is in the developed Asian markets of Japan and South Korea, combined.
What stands out about the North American value segment is that its share of market capitalization (21%) is double its share of revenue (11%). Even though all of these North American companies trade at less than 1.0x P/B and 10x P/E, their significantly higher share of global market capitalization suggests that North American value firms are relatively more expensive compared to their international peers. We believe this point is confirmed in the last column, where we divide aggregate market capitalization by aggregate revenue to estimate Price/Sales ratios for the value segment in each region. Relative to other regions, North American value is the least cheap, with an aggregate Price/Sales ratio of 1.0x, compared to a global average of 0.6x.
Conversely, South Korea appears to be the cheapest developed market, with an aggregate Price/Sales ratio of 0.4x within its value segment. Therefore, we believe South Korea should be a consideration when building a global deep value portfolio.
The global value premium seems to be resurgent, with value outperforming growth by 9.0% annualized over the past five years, according to data from Ken French. Based on the abundance and depth of value opportunities abroad today, we believe international markets offer the greatest upside potential for value investors going forward.