FANMAG Envy
What can investors learn about growth investing by decomposing the returns on FANMAG stocks?
Multiples on growth stocks are high relative to history and have risen significantly over the past three years. The high expectations these expanding multiples imply are based on real results from the FANMAG stocks (Facebook, Apple, Netflix, Microsoft, Amazon, and Google). These expectations have been intensified by a surge of smart investors attempting to identify the next companies that will take advantage of technological innovation to achieve similarly excellent results (emerging cloud stocks being perhaps the best examples of this latter phenomenon).
Below, we show the enterprise value to sales multiples for growth stocks generally and specifically for the FANMAG stocks and the BVP Nasdaq Emerging Cloud Index.
Figure 1: EV/Sales Multiples for Growth Indices

Source: Capital IQ, Verdad. Market-weighted. Data as of 6/30 each year.
Multiples for the profitable growth category were only higher in 1999 and 2000. And the multiples for emerging cloud stocks, which some hope will become the new FANMAGs, are at the same levels as the FANMAG stocks during the dot-com bubble.
Before we get too critical, however, we must acknowledge that these multiples reflect performance. Enterprise value to sales multiples have historically been good predictors of realized sales growth. Below we show the one year forward sales growth by historical enterprise value to sales deciles for US stocks. Low multiples predict low sales growth and high multiples predict high sales growth.
Figure 2: Subsequent-Year Sales Growth by EV/Sales Ratio Decile, 1996–2020

Source: Capital IQ, Verdad. US stocks with over $300 million market cap. Excludes biotech and financials.
To understand what is going on with growth valuations, we need to understand them in the context of value creation. This is where the return decomposition methodology we introduced over the last two weeks in What’s in an Equity Return? and Sales and Distributions becomes crucial to understanding what’s going on. We can define value creation as the sum of returns due to sales growth and returns due to distributed earnings, which in our decomposition is net distributions (see our previous pieces for more detail). Returns from net distributions are most often a small negative for growth stocks, especially for growth stocks early in their life cycle, so most of the value creation for growth indices comes from sales growth. Below we show a chart of FANMAG enterprise value multiples versus realized value creation, defined as sales growth plus return from net distributions.
Figure 3: FANMAG Multiples vs. Subsequent-Year Value Creation

Source: Capital IQ, Verdad. Market-weighted. Data as of 6/30 each year.
The FANMAGs are the success stories of growth. The high enterprise value to sales multiple in the late 1990s presaged high value creation. But despite delivering better value creation in later years, the FANMAGs never again saw the heady multiples of the late 1990s. Clearly those valuations were extreme. Conversely, the recent increases in multiples through 2017 have presaged improving value creation. The FANMAGs have done well, although multiples have continued to expand even as value creation has started to decline.
We can see a broadly similar pattern in the profitable growth segment we defined, which includes between 400 and 700 stocks per year.
Figure 4: Profitable Growth Multiples vs. Subsequent-Year Value Creation

Source: Capital IQ, Verdad. Market-weighted. Data as of 6/30 each year.
Again, the multiples of the late 2000s indeed predicted high value creation, but the stocks never received those kinds of multiples again, despite solid value creation. In this dataset, however, there is a much more pronounced and steady increase in the enterprise value to sales multiples since 2015. This has continued even as value creation started to fall in 2019 and 2020.
Finally, the emerging cloud index also shows the same pattern. High multiples presaged high value creation historically. But multiples have continued to expand despite a slowing of value creation.
Figure 5: Emerging Cloud Multiples vs. Subsequent-Year Value Creation

Source: Capital IQ, Verdad. Market-weighted. Data as of 6/30 each year.
What is particularly interesting about the emerging cloud index is that, as the new generation of FANMAGs, their value creation very closely matches that of the FANMAGs across the 1996–2000 period, and their multiples are nearly as high. We know how that story turned out. The FANMAGs went on to do extremely well but were never rewarded with the same valuation levels again. And, we would note, there are a significant number of companies with valuations higher than the FANMAGs but with much worse fundamentals, a group we call the Bubble 500.
But maybe, just maybe, the market is getting better at pricing growth and is assigning the highest multiples to companies that achieve the highest value creation. After all, the quants can process things like credit card data and Google trends data before the quarterly earnings come out. One way to test this theory would be to see if next year’s value creation is being more accurately predicted by enterprise value to sales multiples today than in the past. Specifically, we can regress the subsequent year’s value creation percentile on the enterprise value to sales percentile each year and look at the r-squared. We use percentiles to make the relationship linear. The results are below. It is hard to see any real pattern in this analysis. If anything, it appears that predictability is highest when the market sells off. More importantly, it confirms that the future remains hard to predict.
Figure 6: R-Squared of Subsequent Year’s Value Creation Percentile Regressed on EV/Sales Percentile
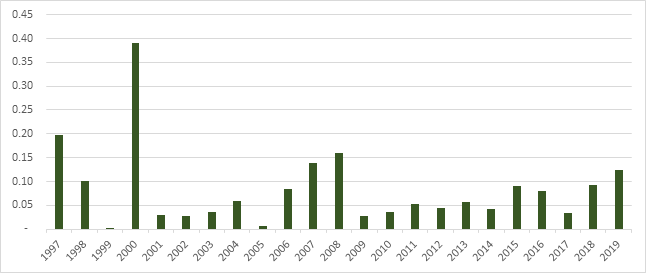
Source: Capital IQ, Verdad. Data as of 6/30 each year.
It is difficult to look at growth multiples today and make a valuation argument based on history. In our view, the data we have shown screams overvaluation. All great bubbles are built on compelling stories, and the FANMAG story is compelling. But all great bubbles are also built on unrealistic expectations, and we believe that those unrealistic expectations are already in the growth stock prices.