COVID & Global Valuations
How Coronavirus Impacted Corporate Revenues & Where Valuations are Today Globally
With Q2 earnings complete, we can now look back and understand the impact that COVID-19 has had on business around the world. Below, we show the distribution of year-over-year change in revenue from Q2 2019 to Q2 2020 by decile for the companies underlying four major regional indices: the S&P 500, the FTSE Europe index, Japan’s TOPIX index, and the MSCI Emerging Market index.
Figure 1: YoY Q2 Revenue Growth by Decile

Source: Capital IQ
The distribution of revenue changes looks broadly similar across these four market indices. About 70% of companies in these four indices saw declines in revenue. The median company in these four indices saw revenue declines of 7–9%. The MSCI Emerging Market index, dominated by Chinese companies, reported slightly better numbers, with median sales decline of 5% and less than 60% of companies showing declines in revenue.
Below we show the same data graphically, with YoY revenue change in Q2 on the x-axis and the percentage of companies with revenue change falling in that range on the y-axis.
Figure 2: Percentage of Companies by YoY Revenue Growth for Major Indices
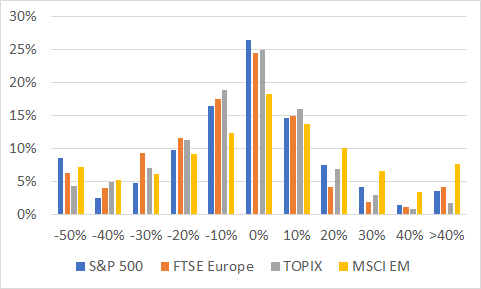
Source: Capital IQ
While the differences in YoY Q2 revenue change is slight, the differences in valuations among indices, which reflect both a reaction to the above data and market expectations for future growth, are massive. The median European stock trades at about half the valuation of the median US stock, with the median Japanese stock trading at half the valuation of the median European stock and one-quarter the valuation of the median US stock. The emerging market index looks comparable to the S&P 500, though slightly cheaper.
Figure 3: Distribution of EV/Sales Multiple by Decile

Source: Capital IQ
The differences in valuation pop when looked at graphically. The below chart shows EV/sales multiples on the x-axis and the percentage of companies in each index trading in that range on the y-axis. Almost 70% of the companies in Japan trade at 1x sales or less.
Figure 4: Distribution of EV/Sales Multiples

Source: Capital IQ
The most dramatic chart, however, is a comparison of the TOPIX to the Nasdaq, shown graphically below. The TOPIX looks like a negative bubble, with the vast majority of stocks trading at less than 1x sales, while the NASDAQ looks like a classic bubble, with over 30% of companies trading at >9x sales.
Figure 5: Distribution of EV/Sales Multiples Topix vs. NASDAQ

Source: Capital IQ
In few times in history have valuations been so widely variable across regions, especially given the fairly even distribution of economic outcomes we saw in Figure 2.