Echoes of Junk Bonds Past
The current direct lending market looks like the ’80s junk bond market
By: Greg Obenshain
There are very few investors working today who traded through the 1980s junk bond crisis. George Santayana wrote that those who can’t remember the past are condemned to repeat it. Great books provide the memory for those of us who were not there, and James Stewart’s Pulitzer Prize–winning book Den of Thieves contains terrific descriptions of the 1980s junk bond market. Stewart’s description of the end of the junk bond frenzy in 1990 might well have been written about today’s private credit market:
“It was as if the nation’s investors had awakened and recognized finally that high returns could not be realized without increased risk.”
The pioneers of private credit have created a product, the single-sourced unitranche loan, that, like junk bonds, will no doubt become a permanent feature of our capital markets. Like junk bonds in the 1980s, these new loans have been both profitable to investors and fantastically profitable to sell. But, as in the 1980s, too much credit has been extended to too-risky borrowers as excessive optimism and a lending boom sow the seeds of a credit crisis.
It is worth revisiting the 1980s to see the similarities. Below we show the default cycle from the junk bond boom.
Figure 1: Moody’s Annual and 3Y Trailing Default Rate, 1977–1992
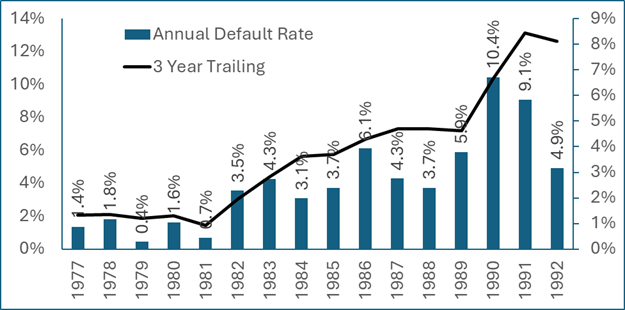
Source: Moody’s.
The junk bond era began with exceptionally low high-yield default rates of under 2%, providing strong supporting evidence for the superior returns of junk bonds. Even as issuance soared through the 1980s, defaults remained below 4% through 1989, with the exception of one spike in 1986. It wasn’t until the end of the era that junk bond default rates spiked to an annualized rate of 10%.
The similarities to today are obvious. We have been in an extended period of low defaults since the great financial crisis. The trailing three-year average high-yield default rate has averaged below 4% for the past 14 years.
Figure 2: Moody’s Annual and 3Y Trailing Default Rate, 1993–2025
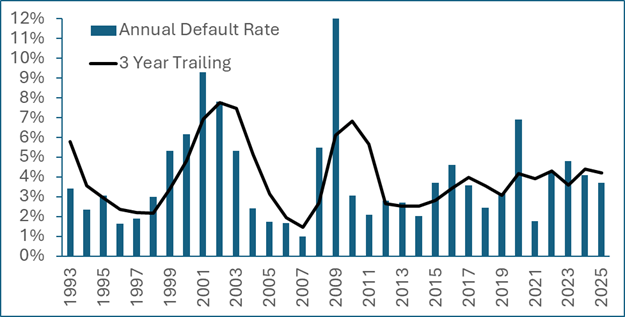
Source: Moody’s High Yield Default Report 2023. Recent values are estimated from public reporting.
This benign default environment, abetted by low interest rates, has driven tremendous inflows. Since 2010, the leveraged lending market, meaning loans or bonds made to sub-investment-grade corporate borrowers, has grown 7.3% per year. About half of that growth has come from direct lending, the portion of private credit that is specifically loans to corporate borrowers, primarily private equity buyouts.
Figure 3: Dollar Growth of High Yield, Leveraged Loans, and Direct Lending since 2010 ($ Trillions)
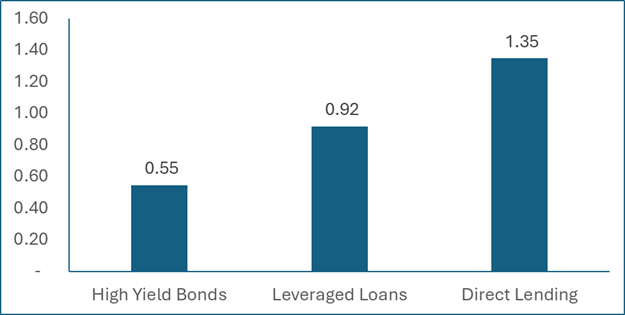
Sources: Bloomberg, Morgan Stanley.
To put these numbers in perspective, the dollar growth of the investment-grade market was $1.3 trillion over the same period. Private credit direct lending, primarily to smaller, riskier companies backed by private equity, has grown more than the investment-grade bond market since 2010. Leverage loans and direct lending combined grew by 11.5% per year while the high-yield bond market and the investment grade bond market each grew just 3.1% per year.
The first chapter in most credit cycles is typically the reversal of flows, not defaults. Flows are the forward indicator of distress both because they reflect future expectations of trouble and because they help reveal the distress. Any asset class receiving inflows benefits from those flows increasing demand for existing assets, shrinking poor-performing assets relative to the size of portfolios, and allowing for refinancing of problems. It takes time for loans to default; newer loans tend to perform.
The past rhymes with the present. Again, from Den of Thieves:
“More threatening trends appeared in Milken’s vast junk-bond empire. In the past, whenever Drexel’s large bond issuers had begun to threaten default on the bonds, Milken had simply arranged an exchange offer, restructuring the debt, usually with even more leverage. The process, resembling a pyramid scheme, had masked credit problems and given Drexel’s bonds an enviably low default rate.
Now the Beverly Hills sales force found it impossible to roll over weak debt into new bonds. Any crack in the junk-bond façade had dire potential, because Milken’s big clients—from savings and loans like Columbia to insurance companies like Executive Life—were already so loaded with junk paper that any decline in the value of their junk portfolios would curb their ability to absorb more.”
What kicks off a credit cycle is a reversal of flows. Right now, the stress in direct lending is a flow story, not a default story. It matters that investors are concerned about private credit, that public BDCs are trading down, and that credit interval funds and non-traded BDCs are seeing redemption requests more than their redemption caps.
This is how the default story begins. When private credit funds argue that the headline defaults aren’t even in direct lending and that they are not yet seeing defaults in their portfolio, this is probably correct. We have not yet seen the default cycle. But investors are not being naïve or irrational. They are making a completely rational choice to redeem their private credit investments at prices that do not reflect distress rather than waiting to redeem at future marks that may.
What might a default cycle look like? To understand that, we first must understand what is inside the direct lending market. Data has been hard to come by, but it is getting easier. Kroll and StepStone have gathered spread and leverage data on thousands of direct lending deals. According to their data, private credit debt to EBITDA is currently around 5x, and spreads over SOFR are currently around 500 basis points. This means that the typical private credit borrower is likely paying out over 40% of profits in interest and can pay down only about 7% of debt per year.
These numbers are likely optimistic. Private companies have wide latitude to adjust EBITDA, and the evidence is that EBITDA in leveraged buyout companies is overstated by 30% at deal inception and that borrowers miss their inflated expectations in following years. This suggests that leverage is closer to 6x and that free cash flow available to pay down debt or reinvest is lower.
So let’s use base rates to think about the likely outcomes for these borrowers in aggregate. A 5x levered loan corresponds to a single B investment. We can see this clearly by looking at the much more transparent (and now generally higher quality) high-yield market, the mature successor to the junk bond market. Here are the leverage metrics for bond issuers by rating as of year-end 2025.
Figure 4: Debt/EBITDA by Rating Category for Bond Issuers
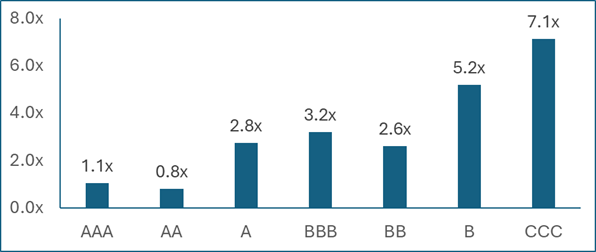
Sources: Bloomberg, Capital IQ, Verdad Analysis. Data as of 12/31/2025. Note that BB, B and CCC ratings are considered high yield (sub-investment grade).
5x levered credits are not investment grade. They are very clearly single B. If true leverage in private credit is closer to 6x or more, then many direct loans could be closer to CCC.
Moody’s has wonderful long-term data on defaults by rating category. According to Moody’s, about 20% of single B securities and 32% of CCC securities defaulted within five years from 1970 to 2023. A 20% five-year cumulative default rate translates to an annual probability of default of 3.7% while 32% translates to 5.7%. Moody’s also provides data on secured loan loss given default, which has averaged around 30% since 1990. This suggests that, on average, investors should expect annual losses of 1.1% for single Bs and 1.8% for CCCs.
But the path is never smooth. Single B credits have historically been downgraded at twice the rate they are upgraded, according to Moody's data, and they are very sensitive to cycles. When times are bad, single B credit does terribly and CCC does worse. Below we show the B1, B2, and B3 default rates from 1983 to 2022 (the most recent year for which the Moody's default data is publicly available).
Figure 5: Moody’s B1, B2, and B3 Issuer Weighted Default Rates, 1983–2022
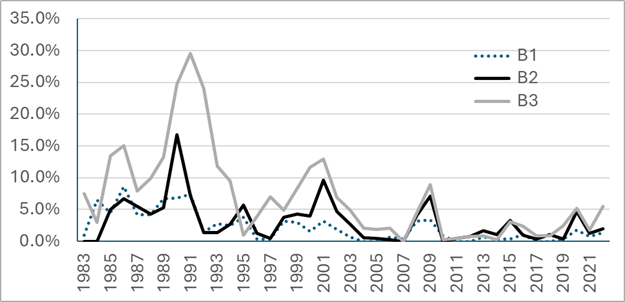
Source: Moody’s. B1 is the highest quality portion of the B universe and B3 the lowest.
The highest level, B1, has a relatively tame default history. But we suspect that most direct lending lives in the B2 category and the B3 category. Those default rates spiked to over 15% in the early 1990s after the junk bond boom. Even in the early 2000s they spiked to over 10%. We can also look at Moody's CCC1 annual default rate data which starts in starts in 1998 and spikes to 15% and 25% in 2000 and 2001.
We don’t know where the default rate will go for private credit direct lending, but spikes to annual default rates of 10% are well within the historical range. And the highly levered, unitranche loans we are concerned with are not the same kind of secured loans that are in the Moody’s historic loss dataset. A better estimate may be losses on unsecured bonds, which have averaged 68%. If we split the difference, that would imply 50% losses given default. If default rates spike to 10%, realized default losses could run at 5% for a few years. For loans that are closer to CCC quality, those losses could run at or above 10% per year.
These kind of default losses are not unprecedented. According to Moody’s, the realized loss rate on single B bonds in 1990 was 8.5%, and in 1991 it was 8.3%.
Right now, many private credit funds are slow to mark down their loans yet offer investors the ability to redeem their investments at 100 cents on the dollar. On average, single B debt does not trade at 100 cents on the dollar, and in times of stress can trade much lower. The redemption pressure we are seeing is completely rational. Private credit funds are offering to pay 100 cents on the dollar for assets that historically do not maintain that mark.
The risk now is liquidity. If credit funds become forced sellers while inflows reverse to outflows, the prices must fall. That will have knock-on effects, not just on private credit fund marks, but also on stressed borrowers’ ability to refinance themselves. Outflows can lead to realized defaults that can lead to further outflows. The classic credit cycle. Even if loss rates turn out to be at or below 8%, prices in a credit cycle can imply far worse outcomes before they bounce back.
The denouement of the junk-bond cycle ended with trading losses erasing years of gains. Again, courtesy of Den of Thieves:
“During the decade ending in 1990, Lipper Analytical Services reported, money invested in the average junk bond grew 145%. That was, in fact, worse than returns on the same amount of money invested in stocks (207%); investment-grade corporate bonds, so often ridiculed by Milken (202%); U.S. Treasury bonds (177%); and equal to returns from low-risk money market funds. During the decade’s last year, junk bonds returned a negative 11.2%.”
Credit investing is resilient. Negative returns tend to be short lived and drawdowns limited. But they do happen, and they especially tend to happen after risky lending masquerading as innovation grows rapidly with the promise of high returns only to be revealed to be the low-quality investment that it is. Often, long bull markets in risky assets lead to another form of innovation, hidden leverage, usually on a sleepy balance sheet. Direct lending losses alone are unlikely to be severe enough on an unlevered basis to cause much harm. But somewhere, there will be leverage that magnifies the losses. There are suspects, but we aren’t at that stage yet. First, we need the outflows. Then the markdowns. Then come the defaults and the surprises.