Capex Cycles
Measuring the impact of higher capex on business fundamentals.
By: Chris Satterthwaite
We are currently in the middle of a massive AI-driven capex cycle that is driving spending in the technology and utilities sectors to new heights.
The key question for investors in these sectors is what the return on this massive investment will be. Some critics are skeptical of tech leaders’ belief that we are in a race to achieve AGI (artificial general intelligence) and that AGI’s value will essentially be infinite. Enthusiasts point out that these leaders have been right on SAAS, mobile, and other big bets.
To try to contextualize this capex cycle, we can look at historical capex cycles across sectors and see what the fruit of that spend has been. There have been many new, exciting, and industry-transforming technological developments over the last 30 years, like the internet, mobile phones, and shale drilling, all of which have driven massive capex cycles.
For this analysis, we aggregated LTM assets, revenues, EBITDA, net income, and capital expenditures across all US-listed companies over the last 30 years, quarterly, by sector. When we scale capex as a percentage of revenue, we can see the historical capex trends clearly for sectors like communications services and energy below.
Figure 1: Capex/Revenue
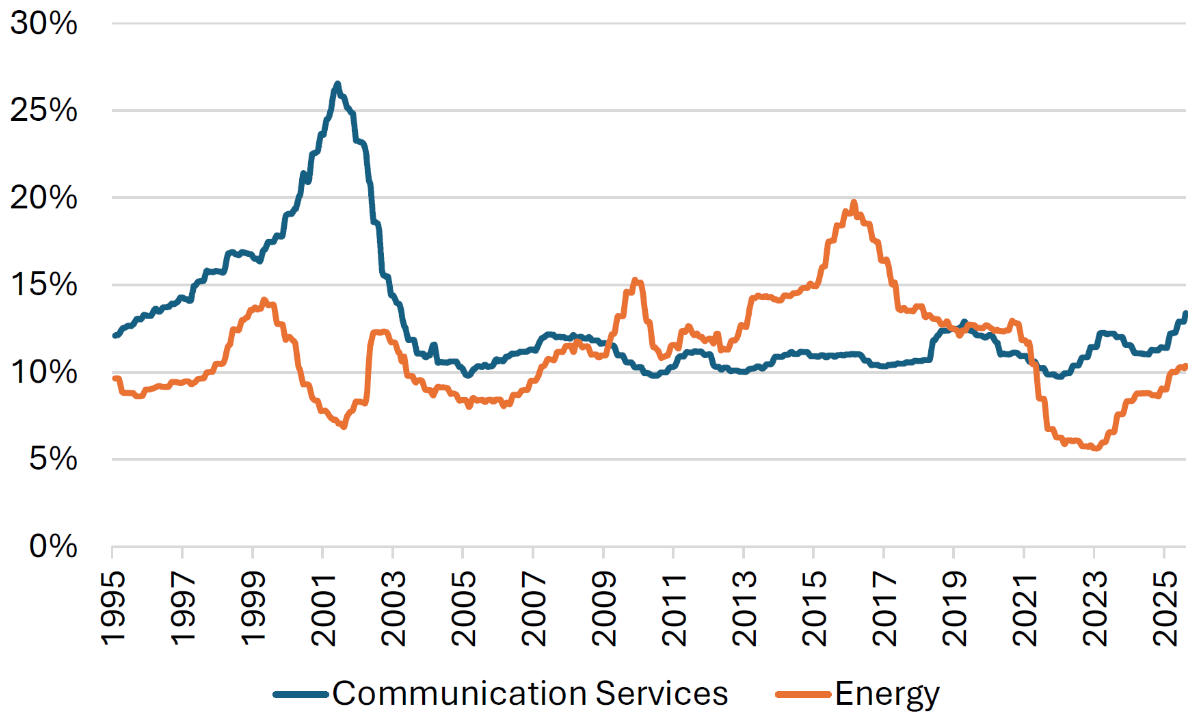
Sources: S&P Capital IQ and Verdad analysis
So what do companies get in return for their capital investments? To answer this question, we regressed forward 12M asset, revenue, EBITDA, and net income growth against the percentile-rank of trailing LTM capex as a percentage of revenue. The percentile rank allows us to control for sector-level differences in capital intensity.
The biggest finding from our regressions, with a high degree of confidence, is that higher capital expenditures as a percentage of revenue generate higher asset growth.
Figure 2: Capex/Revenue (Percentile Rank) vs. FWD 12M Asset Growth
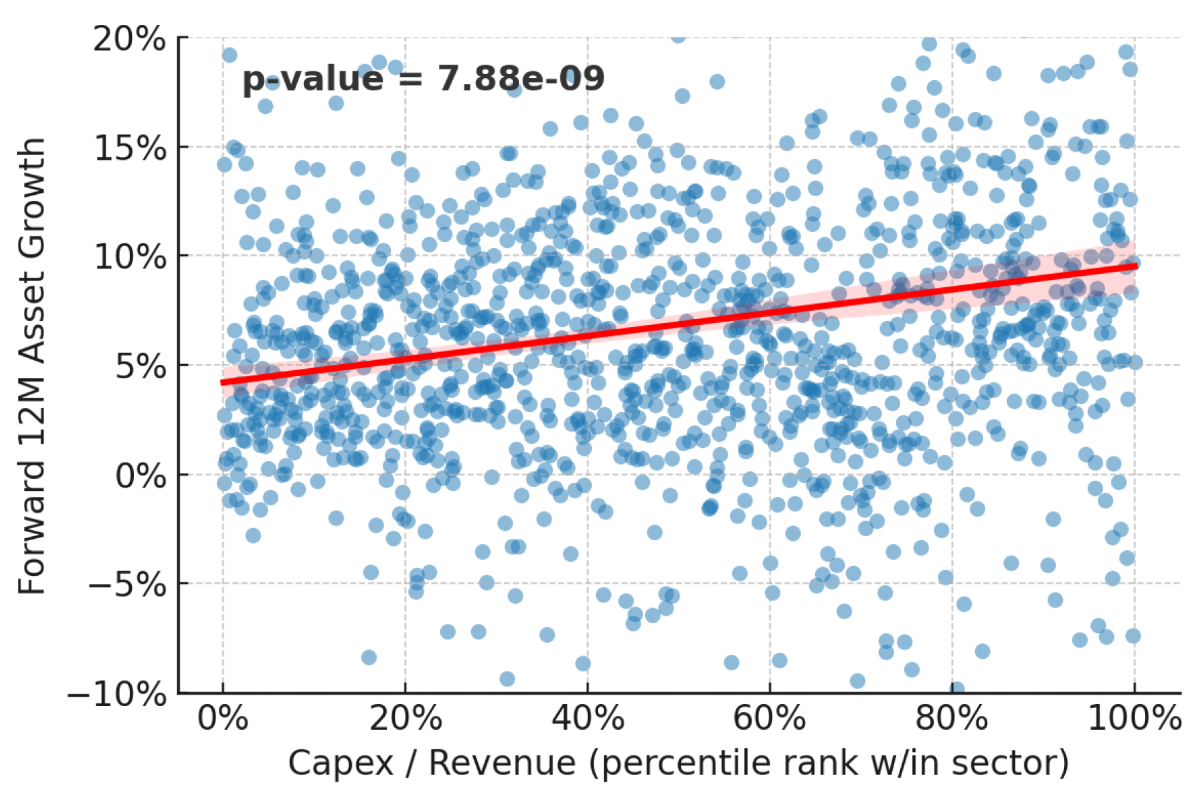
Sources: S&P Capital IQ and Verdad analysis
We agree this is an unsatisfying conclusion, telling us little about the returns on spending. And we have more bad news: Higher capex spend as a percentage of revenue does not predict, with any degree of statistical significance, growth in revenues, EBITDA, or net income over the next 12 months.
Figure 3: Regression of FWD 12M Growth on Capex/Revenue (Percentile Rank)
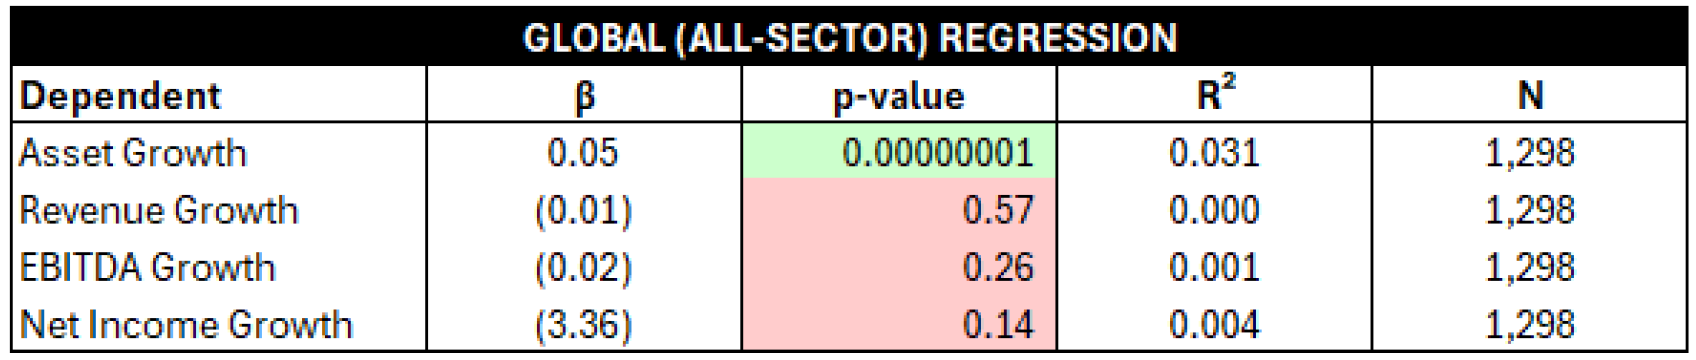
Sources: S&P Capital IQ and Verdad analysis
Looking at the results by sector, we do see some statistically significant trends. For Energy and Materials, higher capital expenditures actually have a statistically significant negative loading on revenue, EBITDA, and net income.
Figure 4: Regression of FWD 12M Growth on Capex/Revenue (Percentile Rank) for Energy & Materials
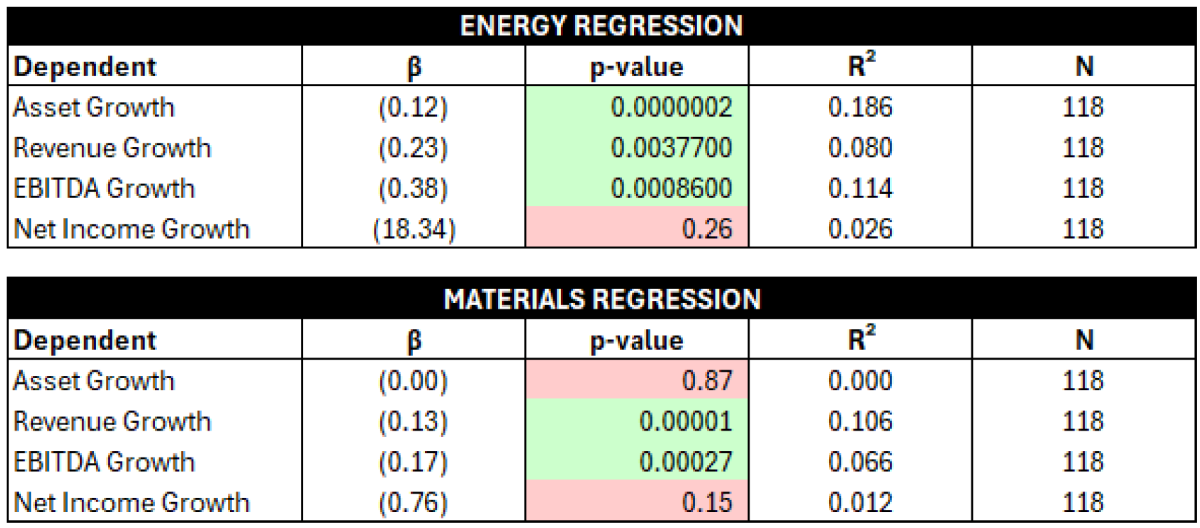
Sources: S&P Capital IQ and Verdad analysis
At first blush, this appears counterintuitive. How can higher investment lead to lower revenues and profitability? For both sectors, the answer lies in the fact that these industries have been dominated by booms and busts, where massive overinvestment leads to oversupply and price declines for the commodities, and vice versa.
The question today is what this means for Info Tech and Utilities, both of which currently sit at the 99th – 100th percentile of capital expenditures as a percentage of revenue.
Figure 5: Capex/Revenue (Percentile Rank) for Info Tech and Utilities
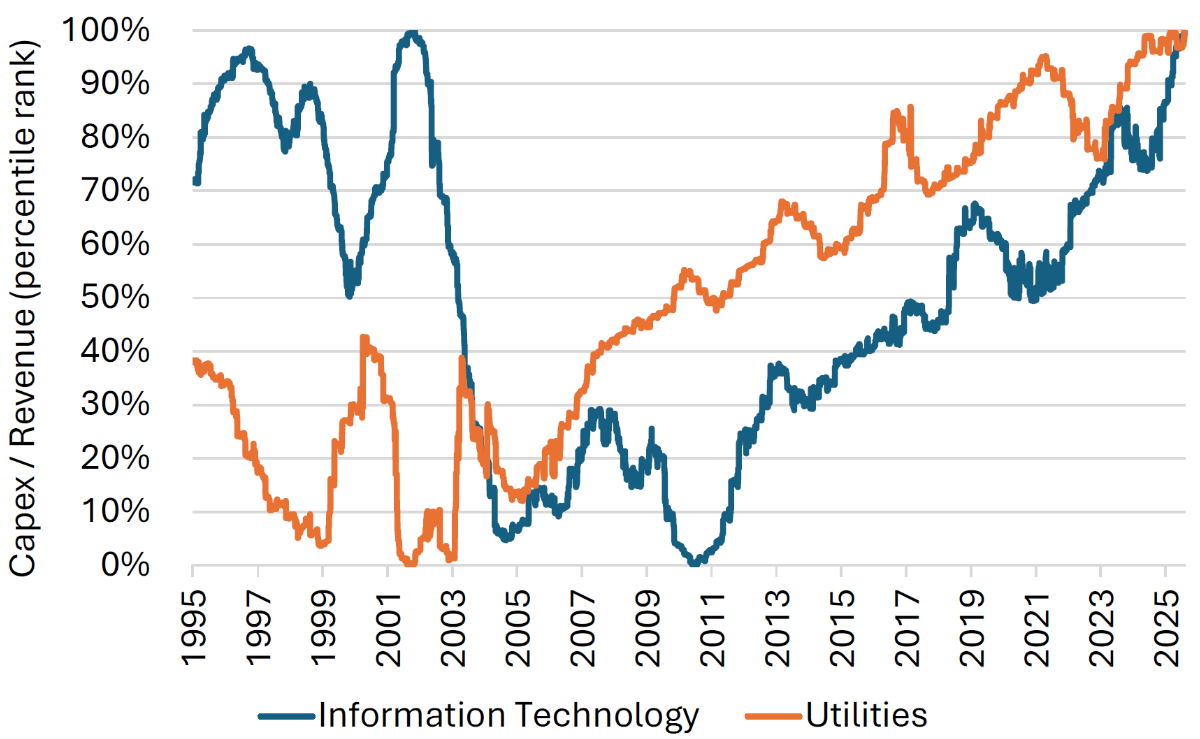
Sources: S&P Capital IQ and Verdad analysis
Both Info Tech and Utilities are at the extreme end of their historical range of capital intensity, with Info Tech rivaling its peak in the dot-com era.
It’s too early to say whether the subsequent iterations of large language models (LLMs) are a commodity product or a life-changing technology with a value of infinity. To be sure, there have been many life-changing innovations over the last 30 years, which have driven massive capex cycles, but it’s not clear that companies, and sectors more broadly, have definitively earned a high ROI on those investments.
We do not know what the ROI on the current capex cycle will be, but we have a sneaking suspicion that the management teams deploying hundreds of billions of dollars in pursuit of AGI don’t know either.
In this case, the best we can do is use history as our guide, and on that account the prospects for the current capital investment cycle should concern investors.