Europe’s Small-Cap Golden Age
Unexpected winners are beginning to emerge in the wake of Liberation Day.
By Brian Chingono and Zach Braffman
A paradox of the tariffs imposed by the United States this year is that, while they are filling the coffers of the US Treasury, the stock market winners thus far appear be international firms. While the S&P 500 has gained 8.5% over the year-to-date period through July 31st, the MSCI Europe Index has rallied 21.5% over the same period. Europe’s small value firms have rallied even further, up 26.9% over the YTD period through July 31st, according to MSCI.
Looking within Europe, we can see that the biggest gains have been among the continent’s domestically oriented firms, which earn almost all of their revenue in Europe.
In the chart below, we plot the performance of two USD indices: one representing Europe’s major exporters to the US, and another representing Europe’s domestically oriented firms. The index of top exporters to the US represents European firms that are in the top quartile of North American revenue share. On average, these firms generate around 41% of their revenue in North America, and the lion’s share of this is earned in the United States. The index of domestically oriented firms comprises European companies that generate zero revenue in North America and are in the top quartile of European revenue share, earning more than 94% of their revenue in Europe.
Figure 1: Indices from Share of Revenue in US vs. Europe (June 2024 – July 2025)
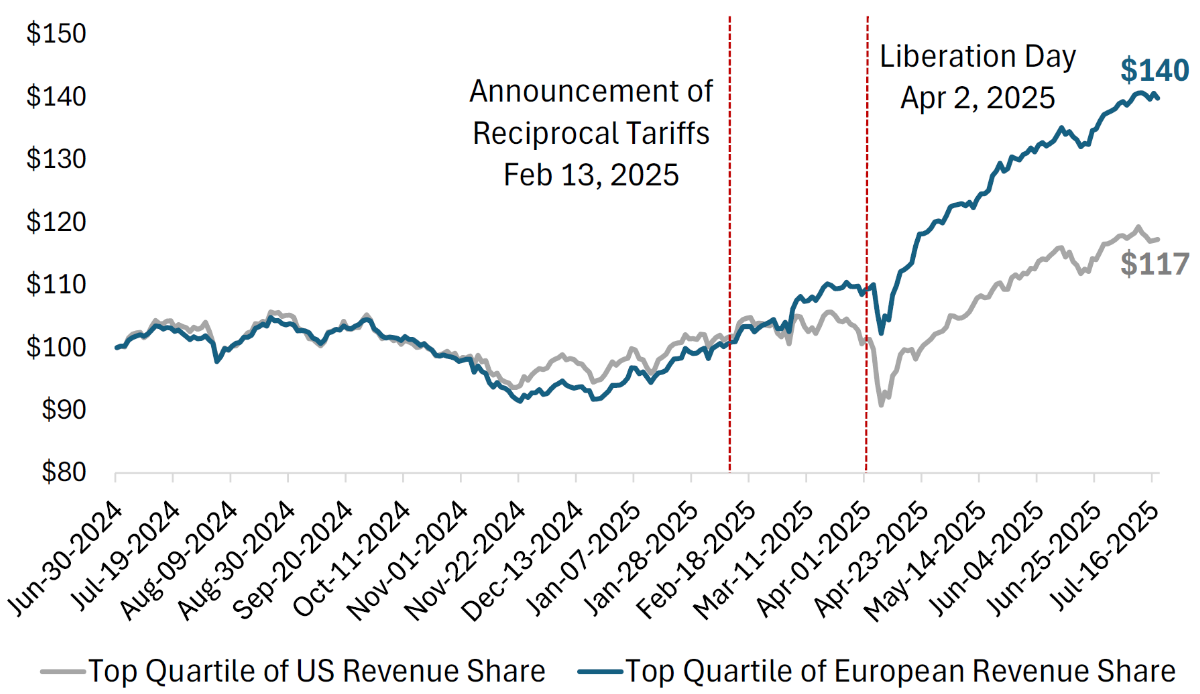
Sources: S&P Capital IQ and Verdad analysis
Evidently, Europe’s domestically oriented firms are emerging as relative winners from the US tariffs. This makes sense because these firms don’t make negative contributions to the US trade deficit, and they are not exposed to the direct effects of US tariffs.
To better understand which types of firms have higher or lower exposure to US tariffs, we segmented all European companies by size, valuation, and sector, and measured how these characteristics are associated with firms’ share of revenue earned in North America.
The analysis was made possible through a classification algorithm we developed to parse through the geographic revenue data for every European company with more than $15M of market cap. This algorithm classified each company’s revenue sources according to five distinct geographies, as shown in the tables below. The result is a standardized measure of revenue sources across all companies. A key innovation of this automated algorithm is that it reconciles inconsistencies in the way different companies may label the same region (for example, “Nordics” and “EU” are both classified as “Europe” in our algorithm).
On average, European firms earn 12% of their revenue in North America. When we segmented all companies by size, we found that larger firms have higher exposure to North America, with large caps earning 24% of their revenue in this region—almost double the exposure of an average European firm. On the other hand, Europe’s microcaps only earn 9% of their revenue in North America, thereby significantly reducing their exposure to the direct effects of US tariffs. Indeed, microcaps are domestically oriented, earning 75% of their revenue in Europe and the UK, on average.
Figure 2: European Firms’ Geographic Revenue by Size (2016 – 2025)
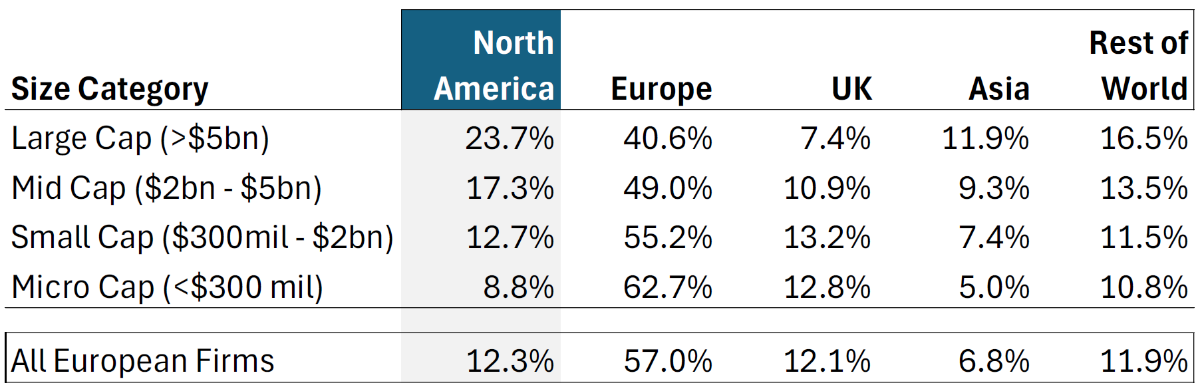
Sources: S&P Capital IQ and Verdad analysis
When we repeated the segmentation analysis by Price/Book valuation, we found that firms with higher valuations are more exposed to the North American market, as shown in the table below.
Figure 3: European Firms’ Geographic Revenue by Valuation (2016 – 2025)
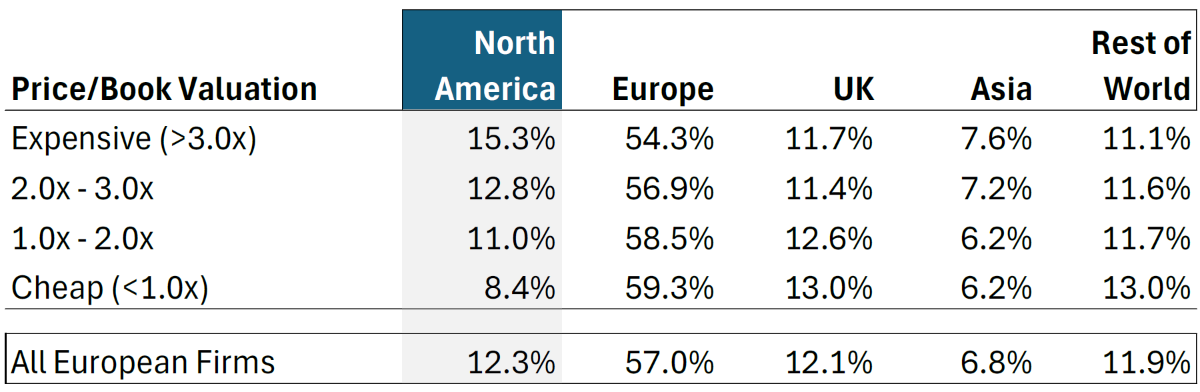
Sources: S&P Capital IQ and Verdad analysis
The positive association between higher valuations and North American exposure may partially be related to sector composition. In the chart below, we show the share of North American revenue within each major sector among European firms. Sectors with the highest share of revenue from North America also tend to be the most expensive in Europe, namely Health Care and Information Technology, which trade at median valuations of 3.2x and 2.9x Price/Book, respectively.
Figure 4: North American Revenue Share by European Sector (2016 – 2025)
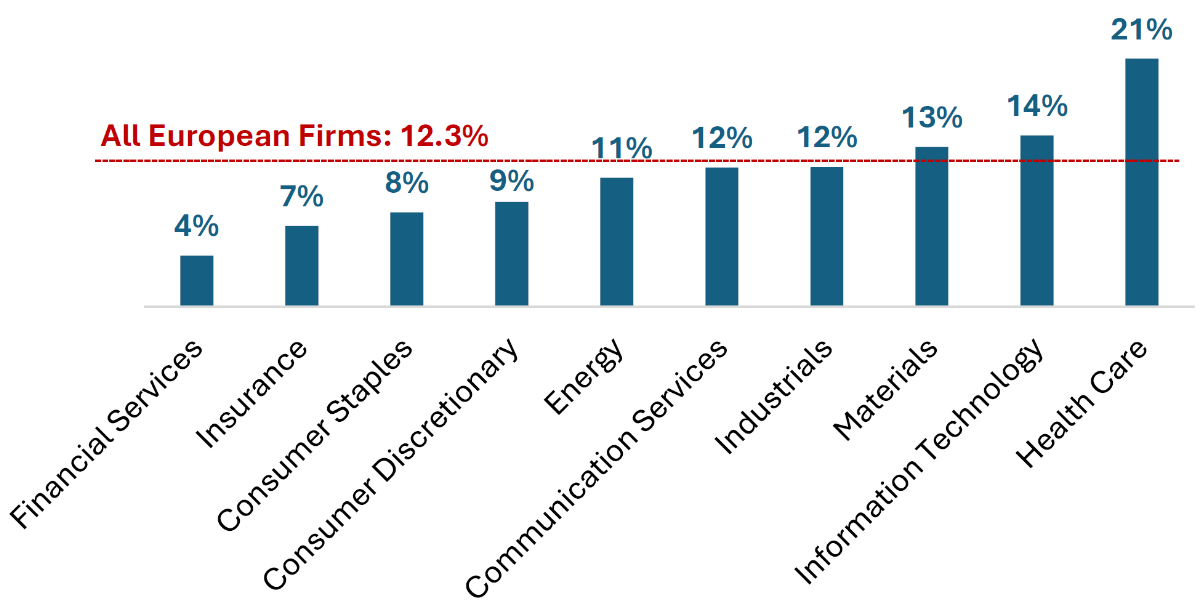
Sources: S&P Capital IQ and Verdad analysis
Another possibility is that investors in European firms who pay up for higher North American exposure are actually getting something in return for this premium, potentially in the form of higher profit margins or faster earnings growth. We will explore this possibility in more detail in a future research note.
Even if such benefits of North American exposure were present in the past, they have now been at least partially offset by baseline tariffs of 15%. The stock market appears to be acknowledging this reality by rewarding Europe’s domestically oriented firms, which also tend to be small and microcaps that operate in traditional “value” sectors. With smaller stocks trading at deep discounts relative to large caps, we believe the outperformance of domestically oriented firms following a historic realignment of trade terms may be ushering in a new Golden Age for Europe’s small and microcaps.
Acknowledgment: This article was written with contributions from Zach Braffman, who developed our classification algorithm. Zach is a senior in the McCormick School of Engineering at Northwestern University, where he majors in Computer Science. On campus, he founded a production company through Northwestern’s entrepreneurship incubator and collaborates with other student startups. After graduation, he plans to pursue a career in investment management. We thoroughly enjoyed working with Zach this summer and would be glad to connect you with him if you’d like an introduction.