A Historical Analysis of Tariffs
Using cliometrics to understand our current situation
By: Daniel Rasmussen & Kyle Englander
The primary driver of equity market volatility is the level of disagreement and uncertainty about future cash flows.
The great challenge facing investors today is that nobody has a great playbook for how to price the economic impact of tariffs. The United States has had low and declining tariffs since World War II. The last instance in which the US recorded a trade surplus was 1975. Nobody alive today has traded through a US tariff increase of this magnitude–and it is that uncertainty, compounded by Trump’s strategic unpredictability, that is sending the VIX to crisis levels.
Figure 1: US Tariffs vs. Trade Balance 1776-2025E
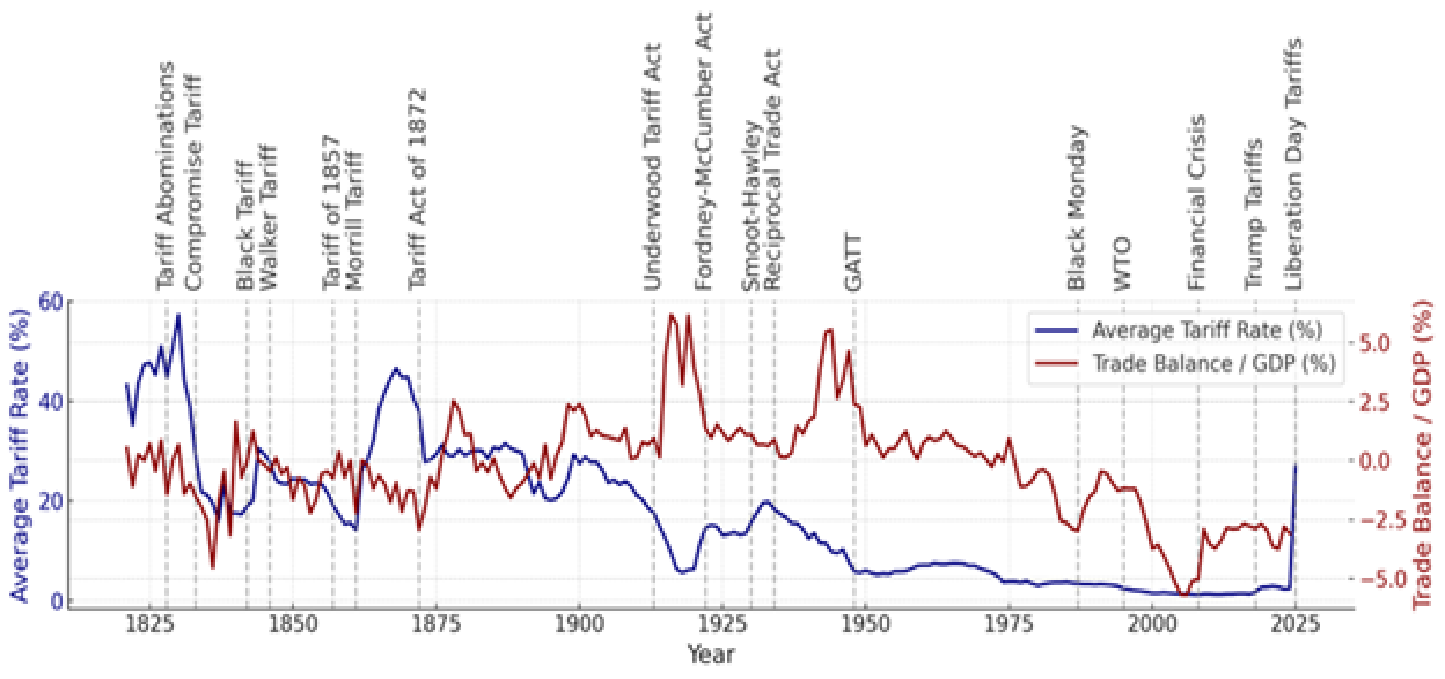
Source: Tax Foundation; US Census Bureau
We haven’t seen tariffs at the scale Trump is proposing since 1903. (This assumes the current effective tariff rate remains unchanged following his 90-day pause: 125% reciprocal on China and 10% on other countries.)
The key question is whether these tariffs will work: Will they reduce the trade deficit? Will they boost American prosperity? And ultimately, what impact will they have on markets?
Dartmouth professor Douglas Irwin is widely regarded as the leading authority on US tariff history. His work—particularly Clashing over Commerce and his paper on 19th-century growth—argues that America’s late-1800s industrial expansion was driven not by tariffs, but by immigration, capital investment, and westward expansion. He finds that tariffs likely hindered growth by raising input costs and did little to boost productivity in tradable sectors. Irwin also emphasizes that protectionism, as seen in the 1930 Smoot-Hawley Tariff, often triggers foreign retaliation and worsens macroeconomic conditions. While most of the academic literature aligns with Irwin’s skepticism, a minority of respected economists such as Harvard's Dani Rodrik argue that targeted tariffs can support development, correct global imbalances, or rebuild industrial capacity. The academic consensus remains that broad-based tariffs are economically costly, but there is a credible, heterodox school that sees value in selective, well-designed trade barriers.
Historical Impacts of Tariffs
We are believers in the power of cliometrics, and so we did a deep dive on the long-term historical data. We assembled a data set going back to 1821 including tariff rates, annual inflation rates, real stock returns, real bond returns, the nominal trade balance, and GDP (nominal and real). We believe the best way to predict the future is to look at historical base rates to develop a probabilistic understanding of how future events might unfold.
To begin, we conducted a simple regression examining how year-over-year changes in tariff rates (from t–1 to t) affected the US trade balance over the subsequent 3 years.
Figure 2: % Change in Average Tariff Rate vs. % Change in Trade Balance/GDP (3 yr Lag) (Excluding Major Exogenous Shocks)
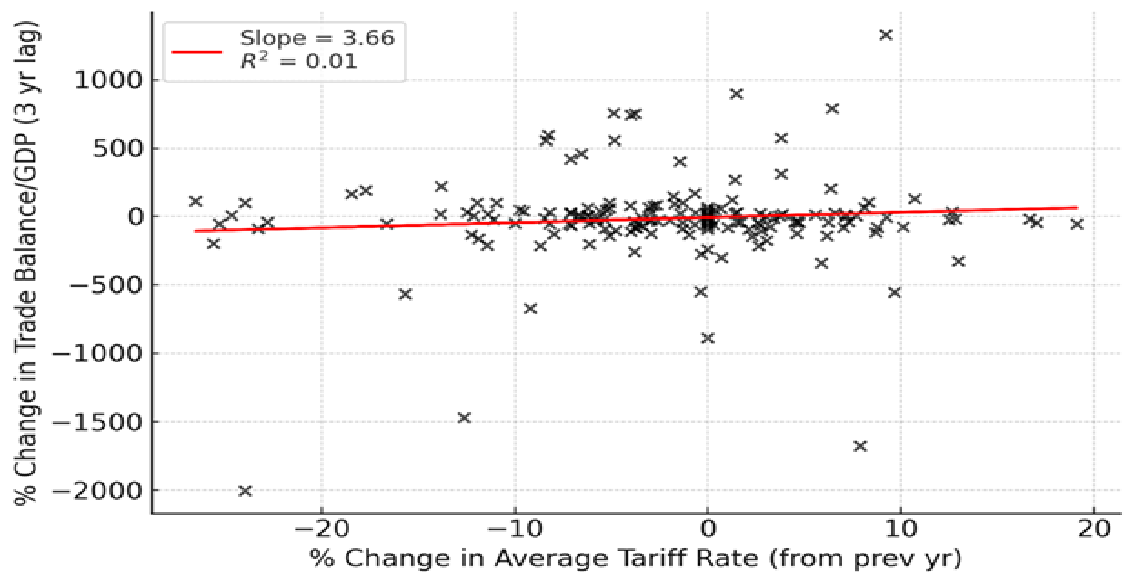
Source: Verdad analysis
The results suggest that tariff changes have not been an effective policy lever for achieving sustained improvements in the trade balance. Specifically, we find no statistically signiticant relationship between changes in the effective average tariff rate and subsequent changes in the trade balance. While we did not extend our analysis to identify the full set of explanatory variables, the broader academic literature concludes that tariffs tend to have limited or short-lived effects on trade balances, particularly once retaliation, exchange-rate adjustments, and broader macroeconomic responses are considered.
We next looked at major historical trade policy events—both protectionist and liberalizing—and tracked how key economic indicators evolved over the three years following each policy's implementation. We measured the change in average tariff rate, real GDP, equity market performance, trade balance as a share of GDP, and inflation. This approach is designed to match the time horizon most relevant to investors—capturing the first 36 months after a policy is enacted.
The below table summarizes the economic data following each major tariff hike.
Figure 3: The Impact of Historical Tariff Increases
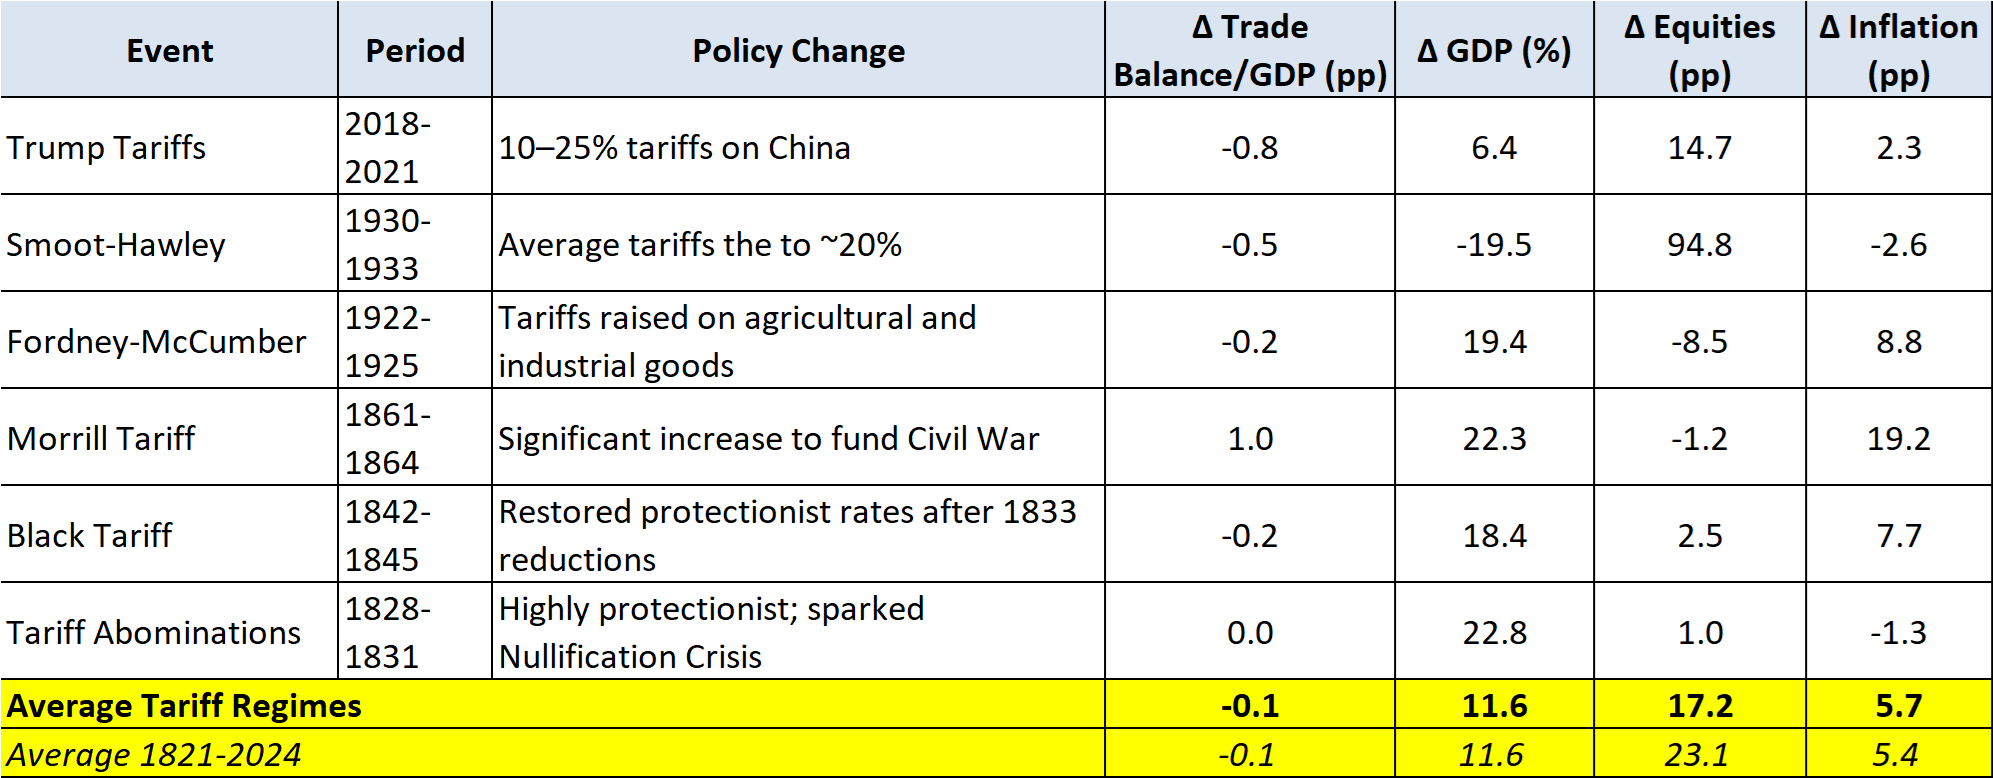
Source: Verdad analysis
Generally, the tariff periods don’t look particularly different from the full-period average from 1821–2024. One could perhaps argue that equity returns look slightly lower and inflation slightly higher, but the differences are miniscule.
We next turn to trade liberalization. The below table lays out the major moments of trade liberalization since 1821.
Figure 4: Impact of Trade Liberalization
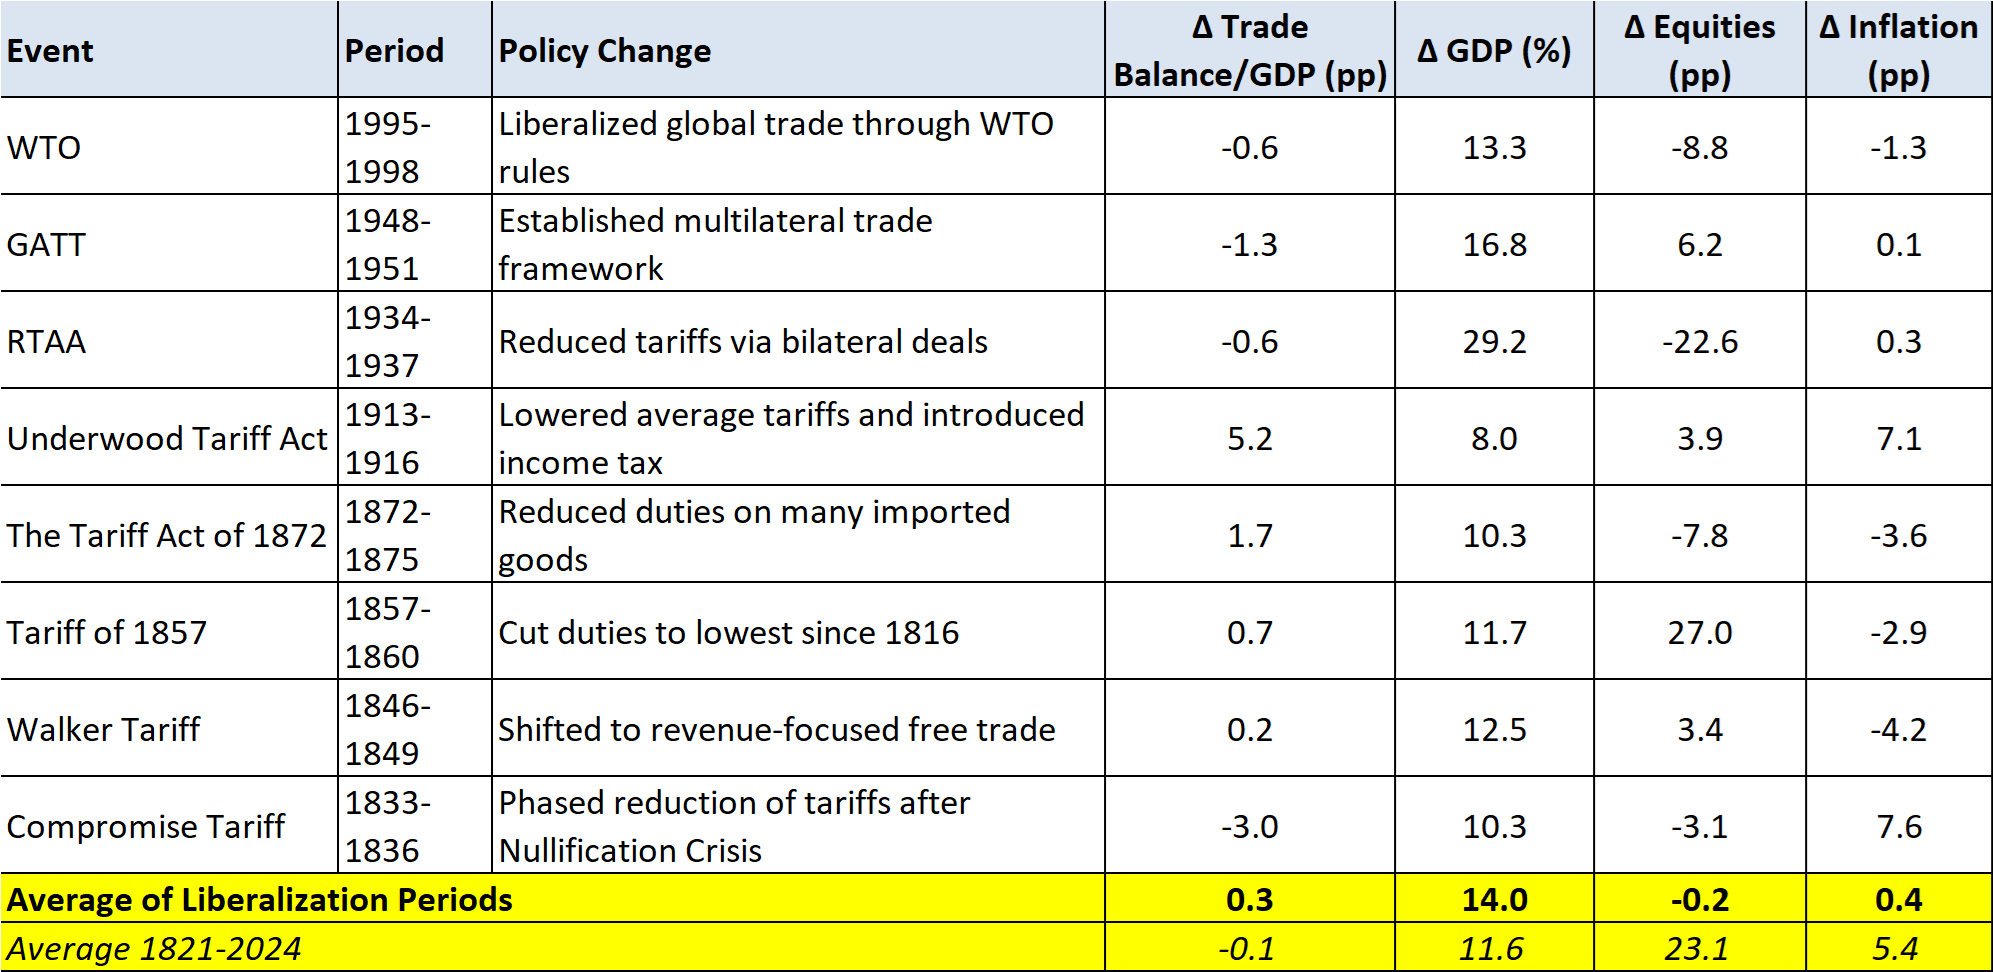
Source: Verdad analysis
Trade liberalization yields a far more nuanced picture. Many liberalizing regimes coincided with deteriorations in the trade balance—particularly GATT (1948), WTO (1995), and the RTAA (1934)—but context matters. These policies often accompanied major structural transitions: GATT aligned with postwar rebuilding, WTO with the rise of global supply chains, and RTAA with the end of Smoot-Hawley and the birth of a multilateral order. Others, like the Underwood Tariff and the 1857 and 1872 cuts, showed strong growth and trade gains—but these were shaped by pre-WWI export surges or deflation-driven trade shifts rather than liberalization alone. While the liberalization average slightly exceeds the long-run macro baseline, it's skewed by these outliers. Excluding them, outcomes converge with historical norms—suggesting that results depend less on tariff direction and more on timing, domestic alignment, and global economic backdrop.
We then examined key exogenous shocks that appeared to have a significant impact on the trade deficit but were not related to trade policy. For each major shock we identified the full time span during which the trade balance shifted significantly. We then calculated the total change in the trade balance as a percentage of GDP from the local minimum prior to the shock to the peak afterward. This min-to-max method captures the full magnitude of trade balance improvement attributable to the shock, regardless of how long it took. These events were not driven by trade policy but nonetheless produced some of the most dramatic corrections in the US trade deficit on record.
Figure 5: Non-Trade Policy Related Shocks
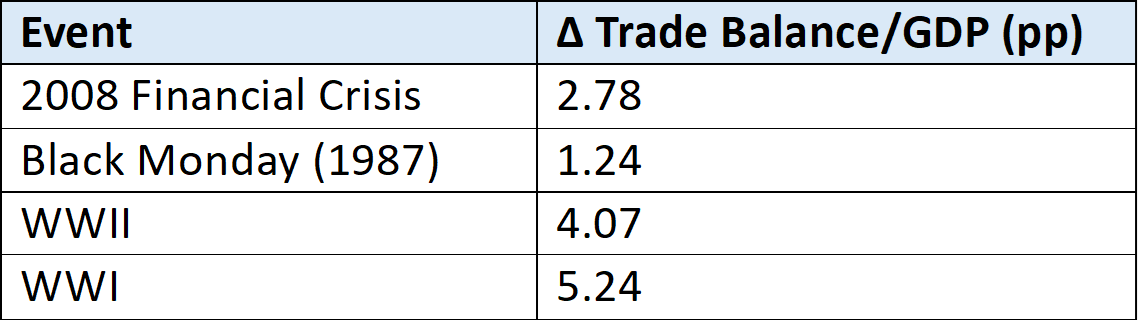
Source: Verdad analysis
When viewed alongside Figures 3 and 4, Figure 5 is perhaps the most revealing. It demonstrates that the largest improvements in the U.S. trade balance were not the product of tariffs—whether raised or lowered—but of macroeconomic dislocation. Credit crises and global wars fundamentally alter capital flows. In credit shocks like 1987 or 2008, they collapse demand, depress consumption, and disrupt the global economic order—narrowing the trade deficit not because exports boom but because imports crash. In contrast, wartime shifts like WWI and WWII drove massive increases in U.S. exports as global production reoriented toward American industrial capacity. These moments do not suggest policy solutions but rather highlight that the trade balance is often a residual outcome of broader financial and geopolitical conditions.
The general lesson from studying history is that tariffs are noisy, blunt instruments—and their macroeconomic effects are more often incidental than intentional. They are poor predictors of trade balance performance and appear to be overwhelmed by broader structural and financial forces. The strongest trade balance improvements emerge not from protectionism or free trade, but from cyclical or exogenous shocks that realign capital flows and reset macroeconomic conditions. Trade policy may shape incentives at the firm or sector level, but it rarely moves the needle at the national scale.
Our Current Situation
We cannot rely on history alone without understanding how today is different from history and considering whether unique dynamics may make today not comparable to prior examples.
The first is the magnitude and persistence of our trade imbalance. As Paul Krugman famously warned, “For a while, the inrush of capital created the illusion of wealth... But bubbles always burst sooner or later, and yesterday’s miracle economies have become today’s basket cases, nations whose assets have evaporated but whose debts remain all too real.” The point stands: no country can run chronic external deficits forever without facing hard limits—whether through currency stress, capital flow reversals, or domestic political backlash.
And, on an absolute basis, the United States is far and away the most imbalanced with a trade deficit of $914.8 billion in 2024.
Figure 6: Major Global Trade Balances as % of GDP
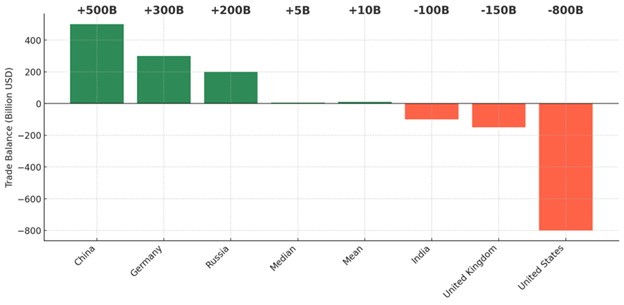
Source: WITS
The US is a notable leader in adopting free trade policies, with our trade restrictiveness index on par or lower than many of our top trading partners.
Figure 7: Trade Restrictiveness Index US vs. Major Trading Partners
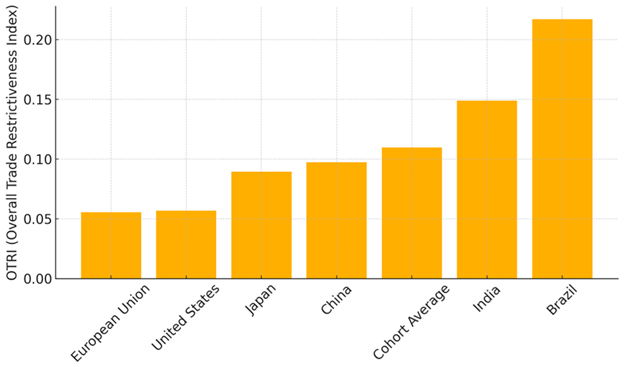
Source: World Bank
It’s possible that one end point of the US tariff increases is as a bargaining tool to drive major trading partners to lower their tariffs on US exports. As Department of Labor economist Julia Pollak noted in critiquing a recent academic paper that suggested dire outcomes as a result of Trump’s tariffs, “Why are the scenarios in the analysis foreign countries keeping their tariffs the same, or foreign countries raising their tariffs in retaliation? It now seems more likely that most of our trading partners will lower their tariffs and trade barriers to avoid our trade penalties.”
Conclusion
Markets have reacted very negatively to Trump’s tariff announcement. The massive spike in the VIX suggests that investors are very uncertain about how these policies will impact the economy and the market.
Our analysis suggests that, over the long-term, tariffs have had relatively minor impacts on GDP, inflation, and equity markets. Perhaps most surprisingly, they’ve had relatively minor impacts on trade imbalances.
Perhaps the best way to think about tariffs, then, is simply as a tax like any other. Trump’s tariff announcement is simply a new consumption tax, levied exclusively on imported goods. And, while this is unusual to the modern investor’s eye, it was quite a normal policy approach in earlier periods of American history, raising about half of the government’s revenue between the Civil War and World War I. Irwin estimates that tariffs cause “about 46 cents of deadweight loss for each dollar raised in revenue, making import duties only slightly less efficient than modern methods of revenue raising through income and sales taxes."
We hope this research has provided enough historical context to demystify tariffs and to provide some probabilistic ranges for how Trump’s tariffs might impact the US economy. Our findings are reassuring in some sense, as tariffs have not historically had catastrophic effects—or even particularly significant effects—on the US economy. But our findings are not optimistic, either, for we find little evidence that tariffs are an effective mechanism for reducing trade deficits. Rather, we come to the conclusion that the macroeconomic impact of tariffs is not dissimilar from that of an income tax increase of similar magnitude—an event which investors have processed without significant indigestion many times in the recent past.
Acknowledgment: Kyle Englander did the heavy lifting on the analytics here. Kyle graduated from Harvard College in 2023 with an A.B. in Economics and completed his senior thesis under the supervision of Professor Larry Summers. He currently serves as a Submarine Officer in the US Navy, having commissioned through ROTC. Kyle has a deep interest in macroeconomics, financial markets, and geopolitics, and enjoys exploring these topics through research and writing in his spare time.