Optimal Duration
We hoped to find a way to earn returns by predicting the shape of the yield curve but learned that predicting the level of rates is all that really matters.
By: Greg Obenshain
Fixed-income professionals find talking about duration and credit rating and yield to maturity to be deeply fascinating intellectual topics. Spouses, friends and colleagues of fixed-income investors can find this type of material about as exciting as hearing about your weird cousin’s model train collection. This newsletter is for all you model train enthusiasts out there.
The recent focus on the inverted yield curve got us wondering if it is possible to make predictions about change in the shape of the yield curve. After all, we know that movements in the level of rates matter, but could we more precisely choose where to be invested on the curve at any given time?
The yield curve today is shown below. The dotted line traces the one-year forward rates at each point.
Figure 1: The Yield Curve and 1Y FWD Rates
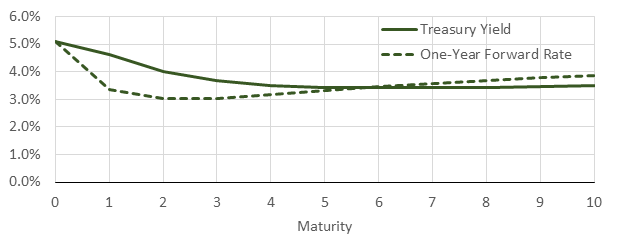
Source: Fitted yield curve values from Gurkaynak, Sack and Wright via Federal Reserve. Fed Funds Rate from Bloomberg. Data as of May 5, 2023.
As has been broadly discussed, the market is expecting rates to fall before they rise again. Can we generate any insight as to how the shape of this yield curve may evolve?
Modeling the shapes of yield curves has been a fascination of academics and practitioners for years. As a result, we now have some very good models. One of the most popular approaches is the Nelson-Siegel model. This model simplifies the yield curve into a highly interpretable regression with coefficients that correspond to the long rate, the short rate, the hump in the curve and the curvature at the long end. It is highly effective at fitting the yield curve with all its twists and turns. In fact, academics have used the model to fit a yield curve every day since 1961, which you can download from the Federal Reserve website here.
One obvious approach to predicting the shape of the yield curve might be to try to predict the coefficients of the Nelson-Siegel model. But there is a problem with this approach. The coefficients are not particularly stable, which turns out to be a well-known problem in academic literature. You can see this in the chart below, which shows the daily Nelson-Siegel coefficients from the Federal Reserve website. We show just the coefficients related to level and slope below.
Figure 2: Nelson-Siegel Level and Slope Coefficients – Unstable and Volatile
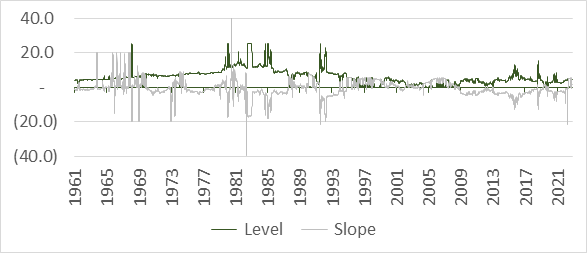
Source: Gurkaynak, Sack and Wright via Federal Reserve
We believe these coefficients are far too volatile and erratic to produce useful models. What to do? As it turns out, academic literature also holds the answer. Most academics simply model each point on the yield curve separately. The advantage of this approach is that, if you use the same variables for each point, you can see how the importance and impact of that variable changes as you go out the yield curve.
We took the approach of predicting forward changes in yields at each point on the yield curve using current measures of changes in inflation, change in the high-yield spread, changes in the stock-bond correlation, and the change in the yield curve. This turned out to be much more promising, in our opinion.
The chart below shows the coefficients for our changes in the high-yield spread variable and the change in our inflation variable.
Figure 3: High Yield, Inflation and Stock-Bond Correlation Coefficients

Source: Verdad macro database. Variables are standardized, and the y-axis shows the change in yield associated with a one standard deviation value of the given predictor variable. Data is from 1990 to 2023.
The negative coefficient on the high-yield spread means that a higher high-yield spread predicts declining yields across the Treasury curve. This accords nicely with our previous research that rising high-yield spreads signal lower growth. All else equal (especially inflation), this would mean lower Treasury yields. Conversely, the positive coefficient for inflation means that high inflation predicts higher Treasury yields, which at this point is hardly controversial. Finally, when the stock-bond correlation is rising, yields tend to rise, and when it is falling, yields tend to fall.
But there is very little shape to these coefficients. They shift rates by about the same amount at each maturity point. The only coefficient that seems to predict changes in the shape of the yield curve is, ironically, the slope of the yield curve itself.
Figure 4: Yield Curve Coefficient

Source: Verdad macro database.Variables are standardized, and the y-axis shows the change in yield associated with a one standard deviation value of the given predictor variable. Data is from 1990 to 2023.
A steep yield curve predicts rising rates at the short end of the curve but falling rates at the long end of the curve. This is at least promising, but there is a problem with our analysis. We are predicting the shape of the yield curve but not returns. And it is returns we care about. If we redo our analysis to predict returns, we get the following result.
Figure 5: Coefficient Values for Returns

Source: Verdad macro database. Variables are standardized, and the y-axis shows the forward return associated with a one standard deviation value of the given predictor variable. Data is from 1990 to 2023.
Gone is any shape that might have existed when we predicted yields. Instead, the impact of each variable increases monotonically with maturity. In short, the longer the maturity and the higher the duration, the more the impact of the variable. What does this mean? It means that the single most important variable to predict is the direction of rates. In fact, over 99% of the time in our data set, 30-year Treasurys went up or down with 1-year Treasurys, just with greater magnitude.
Trying to predict the shape of the yield curve is likely not worth the effort for investors who are not pursuing levered relative value strategies. We believe investors should choose their maturities and durations not based on their opinions of the shift in the shape of the yield curve but how levered they want to be to the outcome, good or bad. It also means that sometimes we do a lot of work to come to simple conclusions.