Private Equity Fundamentals
Rising interest costs and multiple contraction could spell trouble for institutional investors' favorite asset class
By: Daniel Rasmussen & Chris Satterthwaite
Falling valuations and rising costs of debt pose twin challenges to private equity, which today buys companies at premium valuations to public markets and with higher levels of debt. But understanding what’s going on behind the curtain is difficult: these companies, after all, are private.
But we can look at the subset of PE-owned companies that are either publicly listed or have issued public debt as a partial reflection of what’s currently going on in the opaque but important asset class. And we can use this data to understand what’s happening to revenue, EBITDA, and debt generally across private portfolios.
We took a look at all PE/VC-owned public companies, or companies with public debt, that were 30%+ sponsor-owned, had IPOed since 2018, had a recognizable sponsor as the largest holder, and were headquartered in North America. There were 350 companies that met this criteria; the public equities are worth a combined $385B, and we estimate the companies with public debt are worth another $360B of equity, comprising $750B or 6.5% of the total private equity AUM of $11.7T. Notably, the sample of public equities is roughly 40% tech, which is a significant industry bet, and consistent with our previous estimates of private equity industry exposure.
Given that this is the subset that was eligible to be taken public, we would expect this sample to skew toward the higher end of successful outcomes. And, indeed, this group of PE-backed companies had very strong sales growth over the past few years, compounding at 16% versus 7% for the S&P 500.
Figure 1: PE/VC-owned Public Company Sales Growth vs. S&P 500

Source: Capital IQ, Verdad research
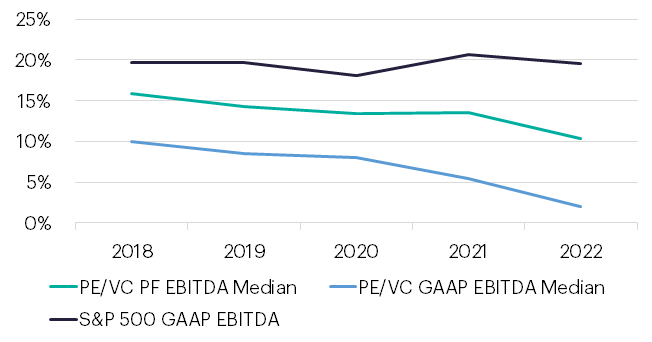
But the story was quite different when looking at EBITDA. We looked at both pro-forma EBITDA, which 50% of the companies in our sample reported, and at GAAP EBITDA. We see below that PE-backed companies in our sample had significantly lower EBITDA margins than the S&P 500, especially on a GAAP basis, and have seen significant margin compression over the past few years. GAAP EBITDA is, perhaps unsurprisingly, much lower than adjusted EBITDA.
Figure 2: PE/VC-Owned Public Company EBITDA Margins vs. S&P 500
Source: Capital IQ, Verdad research
Rising SG&A costs have left the median company barely EBITDA profitable on a GAAP basis. 55% of the PE-backed firms in our sample were free cash flow negative in 2022, and 67% added debt over the last 12 months. As Howard Marks once famously said, “You can’t eat IRR.” We would argue that you also can’t eat pro-forma EBITDA. Interest and taxes are real costs, and here we see a striking difference.
PE/VC-backed companies have significantly more debt and have therefore significantly higher interest costs. The below chart shows interest costs as a percentage of EBITDA for S&P 500 and PE/VC-backed companies in our sample. Note that 2023 numbers will look far worse for private equity given rising rates and the large percentage of PE-debt that is floating rate.
Figure 3: Interest Costs as % EBITDA for PE/VC-Owned Public Companies vs. S&P 500

Source: Capital IQ, Verdad research
As a group, these companies have a median leverage of 4.9x, which is roughly the ratio of the average B-rated company. However, this includes many overcapitalized VC-backed companies, which are difficult to parse out from the private equity LBOs. When we look at only those with net debt, the median leverage increases to 8.8x, which would put the median LBO well into CCC credit rating (for context, the median leverage for the S&P 500 is 1.7x).
With interest rates rising over 500bps in 2022, much of the increase in interest rates is still not reflected in the 2022 reported figures. The cost of loans has soared recently: a $1B loan for a junk-rated company now averages 12%, up from around a 7.5% average in 2021, according to Reuters.
To compound these challenges, public market valuations have fallen sharply. With the S&P 500 trading at 13.6x GAAP EBITDA, multiple compression on exit seems all but inevitable for many deals.
Today, the entire sample trades at 22.4x pro-forma EBITDA, which is roughly in line with the Russell 2000 Growth, where the median company trades at 20.7x EBITDA. However, for companies in our sample that reported both pro-forma and GAAP EBITDA, this includes 500bps of adjustments. On a GAAP basis, these companies trade at 33.4x EBITDA with 8.8x net debt/EBITDA. Most private equity LPs and trade publications look at pro-forma EBITDA, but this sample suggests pro-forma EBITDA is essentially twice that of GAAP EBITDA (500bps different on a margin basis). When we examined the 50% that reported both pro-forma and GAAP EBITDA, we observed the median adjustment was over 55% stock-based compensation. While stock-based compensation is a cash-efficient means of compensation, it has a real cost in the form of dilution and works best to motivate employees in a rising equity market.
The sample of companies we looked at is nearly unprofitable on an EBITDA basis, mostly cash flow negative, and extraordinarily leveraged (mostly with floating-rate debt that is now costing nearly 12%). These companies trade at a dramatic premium to public markets on a GAAP basis, only reaching comparability after massive amounts of pro-forma adjustments. And these are the companies that most likely reflect the better outcomes in private equity. The market and SPAC boom of 2021 presented a window for private equity and venture capital firms to take companies public, and private investors took public what they thought they could. Presumably, what remains in the portfolios was what could not be taken public.
Resolving these challenges will be difficult. Growth seems more challenging in a wobbly economy, and the tailwind of rising multiples has disappeared. Private equity sponsors will likely need to have difficult conversations with their lenders and focus on operational execution to manage costs as they navigate a less friendly macro environment.
From a quantitative perspective, the fundamentals of sponsor-backed companies look frightening. Yet private equity remains the darling asset class of sophisticated investors, with many endowments and family offices nearing a 40% allocation The financial fundamentals look far less attractive than one might expect, given such high level of enthusiasm.