Wrong for the Right Reasons
For about one in four years since 1936, US equities have had negative returns, based on our research. In the average down year, stocks lost approximately 12%. In those years, being in equities at all was a bad decision, as we see it.
For about two in five years since 1936, small-cap value stocks have underperformed US equities. In the average year of underperformance, small value lagged the S&P 500 by 10%. In those years, being in small-cap value instead of the broader market was, in our view, a bad decision.
Looking at the negative years combined with the years of underperformance, investing in US small value stocks was the “wrong” decision in 49% of years going back to 1936, in our view. In those bad years, small value stocks lost 1% on average.
Yet, curiously, over this period, small-cap value stocks outperformed by 5% per year, generating a 15% per year compound annual return versus 10% per year for the S&P 500 generating 2.5x as much money over 20 years and over 6x as much over 40 years.
Despite being the “wrong” decision in one out of every four years, holding the S&P 500 during this whole period was a good decision, from our perspective. But despite being “wrong” in 49% of years, we believe holding the Fama-French small value index was an even better decision.
This is because, in the years that Fama-French small value index worked, it really worked. Based on our research, in the average good year, when the market was up and small value outperformed, investors earned an average 37% return, generating 16% of excess return relative to the S&P 500. We can see these stats in Figure 1 below.
Figure 1: Bad Years and Good Years

Source: Ken French Data Library, Capital IQ
From our perspective, earning this premium required staying invested because the good years were really concentrated in good days.
And watching markets from quarter to quarter or year to year, it’s hard to appreciate just how sporadic those few days were. We counted the last 6,677 trading days for the MSCI Small Value Index going back as far as it goes to 1994. Based on our analysis, missing the best 20 trading days (or 3% of all trading days) would have cut your historical returns in half. And if you missed out on exposure to small value for just the best 10% of trading days, you would have been better off holding cash.
Figure 2: Effect of Missing the Best Trading Days

Source: Capital IQ
And those really rare, phenomenal returns that made the difference were concentrated in times when it would have been most tempting to sit out small value: times when value stocks traded at an extreme discount to growth stocks. Below is the relative performance of small value minus the S&P 500 Index and the ratio of growth stock valuation multiples divided by value stock multiples historically.
Figure 3: Historical Spreads and Relative Annual Performance of Small Value vs. S&P 500
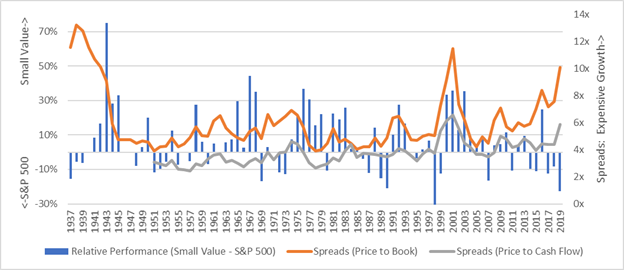
Source: Ken French Data Library, Capital IQ. Spreads are calculated as the 90th percentile breakpoint divided by the 10th percentile breakpoint of valuations for the whole market.
Historically, the small value premium was driven heavily by keeping exposure precisely after small value had underperformed large growth and valuation spreads had risen above historical levels, based on our analysis. Investors were rewarded when small value was least popular and on sale, relative to the rest of the market.
2019 saw the worst relative performance for small value compared to the S&P 500 since 1998 and saw resulting spread levels not seen since then or the early 1940s. We believe those were very, very good times to ignore the crowds and crowded trades and instead be in small value and out of the S&P 500 for the next 5 to 10 years.
But as with history, we believe it will likely be just a handful of highly unpredictable trading days that make that difference between being “right” and “wrong.”