A CCC Opportunity?
By Greg Obenshain (greg@verdadcap.com)
It was a spectacular year for corporate credit. The BBB and BB indices each returned over 15%.
Figure 1: 2019 Corporate Credit Returns by Rating

Source: FRED
But the returns left the CCC index and the single B index behind. Spreads for higher quality credit tightened far less than for BB and BBB credit.
Figure 2: 2019 Change in Corporate Credit Spreads to Treasuries

Source: FRED
This has led some to wonder if perhaps CCCs could represent an attractive investment opportunity. Will CCCs make up for their lagging 2019 performance with significant mean reversion in 2020? And are these >10% yields on CCC bonds enough to compensate for the risk?
Let’s start with the base rates from the last 25 years of CCC performance. In Figure 3 below, we compare entry yields to one-year-forward returns and loss ratios.
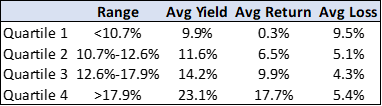
Figure 3: Yields, Average 1-Year Returns, and Average Losses for CCC Bonds 1996-2020
Source: FRED
Today, CCC bonds yield 12.1%, in the second quartile of historical yields, according to our research. Losses on CCCs in a second quartile were about 55% of the yield, which could imply a forward one-year return estimate based on base rates of 5.3%. However, that 5.3% yield comes with a significant downside risk: if you catch the wrong point in the cycle, all of the yield can be eaten by losses, as shown in the Quartile 1 line above.
Compare this to the experience of BB bonds.
Figure 4: Yields, Average 1-Year Returns, and Average Losses for BB Bonds 1996-2020

Source: FRED
BB bonds today yield 3.6%, in the first quartile of historical yields, based on our research. But even in the first quartile, BB bonds earned their yields. It seems, on average, BB bonds outperform their yields by 5%.
The reason for this substantial difference in losses is clear to us from looking at the credit statistics that characterize each rating category.
Figure 5: Credit Quality by Rating

Source: Verdad Debt Database. Statistics are market weighted. Yields and spreads will not exactly match BofA Merrill Lynch index due to bond inclusion and calculation differences.
Two things became immediately obvious to us. First, the BB index has a leverage, free cash flow, and profitability profile that is much nearer to BBB quality than single B quality. Second, the credit quality drops off quickly into the single B category and is awful in the CCC category. The average CCC has negative free cash flow, near zero return on assets, and a massive 13.9x debt/EBITDA load.
There are times to invest in the riskiest credit, but we believe that is when CCC spreads are at a historic wide to their own history, not just wide relative to safer securities. The equity-like returns promised by CCCs often prove to be just a mirage. On the other hand, we believe the yields on higher quality credit are more likely to be realized. They rarely look attractive relative to the seductive promises of riskier credit, especially in a low return environment, but the reliable option could be more likely to surprise to the upside and be the better long-term hold.
Remember, you don't have to play the deck dealt to you by today's market. The market is always turning over new cards, creating new opportunities,, and sometimes the prudent course is to wait for a better hand.