Why Do Most Active Managers Fail?
Why do most active managers fail to beat the market? It’s a question we have returned to over and over again in our research.
We have hypothesized that one problem with active managers is that they base their investment strategies on bad theory. Most active managers use DCF models, spend untold hours forecasting unpredictable earnings growth rates, look for glamorous “competitively advantaged” businesses, try to back great CEOs, and generally follow a variety of empirically invalidated approaches in their efforts to beat the index.
But a new study suggests that the problem isn’t just that active managers slavishly follow bad theories but rather that they persistently refuse to apply good theory. Value investing is one of the simplest and best investing ideas, pioneered by Benjamin Graham, confirmed empirically by Fama and French, and replicated dozens of times in study after study. But after performing a comprehensive analysis of the portfolios of active mutual funds, ETFs, and hedge funds, Martin Lettau of UC Berkeley found that there were virtually no funds that actually exclusively held the cheapest stocks. In fact, most “value” funds hold a higher proportion of their portfolios in expensive growth stocks than cheap value stocks.
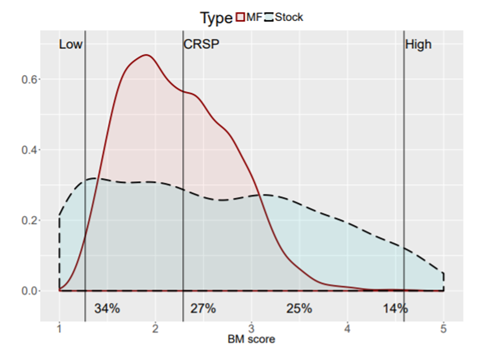
Active mutual fund portfolios skew heavily toward expensive growth stocks and away from the value stocks that theory and evidence suggest provide the most attractive forward returns. Lettau charted the value-weighted average book-to-market ratio for each mutual fund. The below histogram shows the distribution of funds. The x-axis is divided into quintiles based on the book-to-market ratios of all the stocks in the stock market, with the most expensive quintile (low book-to-market) on the left and the cheapest quintile (high book-to-market) on the right.
Figure 1: Distribution of Mutual Funds by Value-Weighted Avg. Book-to-Market Ratio 1980–2016

Source: Lettau et al., “Characteristics of Mutual Fund Portfolios: Where Are the Value Funds?”
There are almost no value funds that score in the fourth or fifth quintile of value. Comparing the distribution of mutual funds versus the distribution of stocks, we see a massive difference, with active managers almost completely avoiding the cheapest stocks (high book-to-market) while instead owning primarily stocks that are more expensive (low book-to-market).
Figure 2: Distribution of Mutual Fund Holdings vs. S&P 500 Constituents by Book-to-Market Ratio 1980–2016
Source: Lettau et al., “Characteristics of Mutual Fund Portfolios: Where Are the Value Funds?”
The authors find similar results for hedge funds and ETFs. They conclude that it is virtually impossible to find mutual funds that provide true exposure to the value factor as defined in academic research. We believe value is one of the best proven strategies for beating the market. Yet the portfolios of active managers are tilted toward expensive growth stocks.
The authors are puzzled by these findings. “How can the stylized facts presented in this paper be reconciled with the evidence that capital flows react strongly to past performance? Since returns of high-BM [cheap] stocks are on average higher than returns of low-BM [expensive] stocks, capital should flow from low-BM funds into high-BM mutual funds over the sample, and the number of high-BM funds should increase relative to the number of low-BM funds,” they write. “Yet, there is no evidence to support this conjecture.”
What explains this puzzle? Why are active managers almost completely avoiding the cheapest two quintiles of the market and skewing their portfolios so heavily toward expensive growth stocks? The bad theories we cited are certainly a factor: expensive glamor stocks tend to have high forecast growth rates, star CEOs, wide moats, and sexy stories.
But perhaps the most important and underappreciated reason for this puzzling finding is structural: the business incentives of active management itself.
Below we show a table dividing the US stock market into deciles based on price-to-book ratio. There is a strong linear relationship between valuation, market capitalization, and traded volume.The cheapest two deciles of the stock market have median market capitalizations of less than $400M and median daily trading volume less than $1.5M (in contrast, the most expensive two deciles have median market capitalization of over $1.9B and average daily volume of over $15M).
Figure 3: Descriptive Characteristics of the US Stock Market Divided by Valuation Decile

Note: Implied fund capacity assumes a diversified 40-stock portfolio at 3x the daily volume of the median stock. Source: Capital IQ, Verdad.
To put it simply, the cheapest stocks are disproportionately small in terms of size and volume. This means that an active manager looking to choose, say, the best 40 of these stocks would be unable to manage more than $200M or so. Even a more passive, quasi-indexed, approach owning the 200 cheapest stocks could only handle about $1B. And, unfortunately, even the index providers have chosen to go for scale, with Vanguard’s US small value fund managing about $26B and Dimensional’s US small value fund managing $14B. This leaves investors with few options for accessing the academic value premium - particularly with any active overlay – and has created disappointment for investors who buy value funds expecting to get the academic value premium.
To further illustrate how constrained the universe of true value stocks is, consider the below scatter plot, which charts US companies by price-to-book ratio on the y axis and market cap on the x axis. The only company above $400M of market cap in the bottom two deciles of valuation is a Canadian gold miner with 9.8x debt/EBITDA and a -90% LTM stock price return: not exactly something anyone should be putting a large percentage of their fund in.
Figure 4: Scatter Plot of US Equities by Valuation and Market Cap

Source: Verdad, Capital IQ.
The cheapest two deciles of the market are almost entirely composed of micro-cap stocks that are hard for any fund with >$200M in assets under management to trade. A manager attempting to build a portfolio composed of the bottom two deciles of value would therefore have to restrict assets under management to <$200M, a business decision that very few fund management companies are willing to make given that it sets a limit on the revenue and profit the manager can earn.
In fact, the average small value fund tracked by Morningstar has $1.3B of assets under management. It is close to impossible to deploy that amount of capital exclusively in the cheapest two deciles of the stock market. These managers are instead stuck with a universe of potential opportunities that, by virtue of market capitalization and tradable volume, have almost no true value stocks as measured by purely quantitative methods.
We have made a different business decision than most active managers. Our global fund has a book-to-market ratio of 0.8, which puts us in the ninth decile of the market by cheapness. The cost of being a true value fund is that we plan to cap the size of this fund at $200M and close to new investors at $100M. We believe this discipline—and slavish adherence to good theory—is what will allow Verdad to succeed where most active managers fail.