Not So Great Expectations: Part II
In Part I we reviewed the Bank of Japan’s quarterly TANKAN business confidence survey data of ~10,000 businesses each quarter, dating back to 1974, to see if corporate expectations about tomorrow’s business confidence were any good at forecasting tomorrow’s actual business confidence.
We found that over the ~50 years, surveyed expectations about future business confidence were systematically inaccurate. Specifically, we found that they were overly pessimistic in their expectations. A “no change” forecast, presuming tomorrow’s business confidence would be about the same as today’s, would have resulted in about 40x less aggregate forecast error than using the human corporate forecasts as a leading indicator.
But what, if anything, do those inaccurate business sentiment forecasts reveal about future equity prices?
To answer this, we started by regressing the returns on the TOPIX index against the company predictions of changes in business confidence next quarter, the absolute level of business optimism at the time, and the valuation multiple of the TOPIX at the time. Did company expectations about confidence next quarter, their overall confidence at the time, or the price of securities at the time help explain future returns of the TOPIX index?
Figure 1: Regression T-Stat Results of TOPIX Returns vs. Business Confidence and EBITDA Multiple (1992–2015) 1
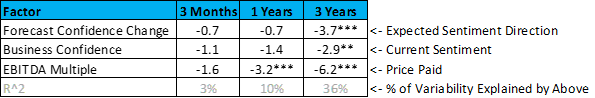
Nothing predicted next quarter’s returns reliably. On longer horizons, the best returns seemed to occur when businesses thought things were getting worse, they were not confident today, and/or (most importantly) securities were cheap. This suggests that positive business confidence forecasts are not a good leading indicator of long-term stock market performance, but quite the opposite.
If we visualize the outcomes in TOPIX returns along the metric of company expectations of future business confidence, we can start to see where the error is occurring.
Figure 2: Regression Line Fit Plot Along Forecast Change in Business Confidence (Last 100 Quarters) 1

Consensus pessimism about future business conditions (left half of chart) is positively related to long-term equity returns, even with a valuation control variable. However, in Japan, there appears to be no strong relationship for optimism (right half of chart). Most good market bets were made precisely when others thought things would get worse.
But what if we take a more granular look at each industry’s forecasts in each quarter and each industry’s forward returns? To do this, we matched each BOJ survey response group to the closest equivalent MSCI industry or sector index to get price returns data. In other words, the sentiment forecasts of CFOs from Industrial Machinery industries were compared to the price returns of the MSCI Japan Machinery index, Chemicals company forecasts to MSCI Chemicals, and so on for the 44 industry groups surveyed.
Our observations jump from ~100 quarterly estimates from 10,000 businesses aggregated across different industries to ~3,000 observations for the 44 industries where industry-specific price return data was available from MSCI (about 30 years from 1990 and onward).
We saw nearly identical results with even stronger statistical significance for all three drivers of equity price returns. Valuation is still king, and again this time industry business confidence and forecasted changes in confidence were strongly negative in predicting price return.
Below we show you the scatter plot of the results. Again, bad consensus expectation times were particularly good times to invest (left half of chart). Good consensus expectation times didn’t really mean that much (right half of chart).
Figure 3: Scatter Plot Along Forecast Change in Industry Confidence (n=2902) 1

This matches with the sentiment forecast inaccuracy patterns we showed you in Part I and have included again below. Price return forecasts are not shown below, only business expectations about tomorrow’s animal spirits in the business community.
Figure 4: Histogram of Human Business Confidence Forecasts and Actual Confidence Outcomes (1974–2018; n=6175) 1

There are two notable takeaways from this research:
First, consensus business expectation indicators may be “important leading economic indicators” that “accurately predict the economy.” We did not test this directly. However, the data here suggest that, even if this were true, they are not a good leading indicator of long-term price returns, but quite the opposite. If those consensus economic expectations are systematically wrong (as we have shown you), all the more reason to be a contrarian in the stock market. In the meta-analytical endeavor of investing, contrarianism seems to be better supported by the data. Investors bet on stocks, not economies, and stocks already have consensus expectations priced in.
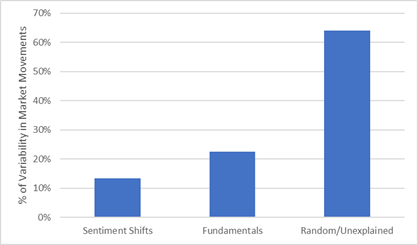
Second, with this long-term data on actual human sentiments, we can start to take an educated guess at what does and does not explain market movements beyond traditional fundamental valuations. Actual sentiment expectations help to explain the variability in long-term market returns when combined with traditional valuation metrics like EBITDA multiples. However, this data suggests that shifts in human sentiment account for about half of the explanatory power of traditional valuation metrics. Most profoundly, even with both inputs complementing each other in the simplest possible model incorporating both fundamentals and actual long-term sentiment survey data, we still cannot explain ~70% of real market movements. The vast majority of market movements remain completely unpredictable even after using the best data we have on sentiment. Accordingly, investors should focus their efforts on optimized models for unpredictable rather than predictable environments. The rare investors who start from the presumption of unpredictability currently have the most accurate picture of reality.
Figure 5: Relative Explanatory Power of Popular Factors Used to Understand Market Variability1
It may be tempting to dismiss these findings as a peculiarity of the Japanese environment and Japanese investor psychology. While that logic might make sense for the company-level forecast errors, it is problematic when applied to market movements. Since the 1990s, foreign investors have been the single largest plurality of owners of Japanese stocks at about one third of the market today compared to about 15% for individual Japanese investors.
We hope this series has added some empirical evidence from long-term sentiment survey data supporting a theoretical explanation of the value premium beyond pattern recognition in equity price returns and fundamental factors—a supporting link between measurable contrarianism and value returns.
1Note: Bank of Japan TANKAN surveys, CapitalIQ and MSCI GICS industry indexes for price return data, Verdad Analysis. Other great studies on sentiment and Japanese markets: Shiller 5-year study on actual survey response data; NBER 2-year study on fund flows as a proxy for sentiment.