What Works in Bank Stocks
Long-term lessons on separating winners from losers
By: Chris Satterthwaite with Carolina Bartunek and Joe Ewing
With the rapid rise in interest rates, and the collapse of Silicon Valley Bank (SVB), First Republic, and Credit Suisse, the banking industry has experienced significant volatility this year. Regional banks were on the ropes throughout much of March and April, but equities seem to have recovered most of the losses in June and July.
In general, banks have been one of the lower-performing sectors since 2000, underperforming the total S&P 500 by a wide margin over the last 20 years.
Figure 1: KBW Bank Index Total Return vs. S&P 500 Total Return (2000–2023)

Source: Bloomberg, Verdad analysis. The KBW Bank Index is one of the longest-running and widely quoted bank indices.
Given the volatility, we thought it would be timely to look at the factors that we believe most effectively predict bank returns. We looked at 35 potential predictors of bank equity returns for the largest 50% of US-listed banks from 1996 to 2023, comprising roughly 300 banks each month. We also looked at the “hit rate” or percentage of companies in each decile that beat the market cap-weighted bank return for that same period. This helps to decompose the “batting average” from the “slugging percentage.”
Banks have different business models and financial statements from most other equities, but many of the factors that we have previously written about, namely value and quality, can work equally well with banks.
Below we show the linear relationship between a simple value composite and forward returns from 1996 to 2023.
Figure 2: 3M Forward Returns by Value Composite Decile (1996–2023)

Source: Capital IQ, Verdad analysis. Value Composite is a blend of P/E, P/B, and P/Cash Flow.
We then show the linear relationship between a simple quality composite and forward returns from 1996 to 2023.
Figure 3: 3M Forward Returns by Quality Composite Decile (1996–2023)

Source: Capital IQ, Verdad analysis. Quality Composite is a blend of ROE and ROA.
While these factors have also been shown to work with other equities, we did find evidence of some bank-specific factors that are predictive of forward returns, notably the quality of the loan and asset portfolios.
We tested metrics related to loan performance, including non-performing assets and loans, loan loss provisions, charge-off ratios, and capital adequacy ratios, which have all been explored in academic literature. We found three metrics that most effectively captured the quality of the loan book: non-performing loans (% of loans), non-performing assets (% of assets), and net charge-offs (gross charge-offs – recovered debt). The three-month forward returns for the composite loan quality metric are shown below.
Figure 4: 3M Forward Returns by Loan Quality Composite Decile (1996–2023)

Source: Capital IQ, Verdad analysis. Loan Quality Composite is a blend of non-performing loans, non-performing assets, and net charge-offs.
This is noisier than the value and quality signals, but generally banks with lower levels of non-performing loans and assets and lower net charge-offs have realized higher forward three-month returns on average from 2000 to 2023.
We combined all the composite metrics outlined above into a linear regression. We regressed these composite variables on excess bank returns (relative to cap-weighted bank average) to try to explain the difference among bank returns. The results of the regression are shown below.
Figure 5: Linear Regression Outputs (3M Forward Excess Bank Returns)

Source: Verdad analysis
Perhaps unsurprisingly, banks that were cheaper, higher quality, and had high-quality loan books tended to outperform. A backtest strategy of owning the market cap-weighted top decile of ranked stocks rebalanced monthly from the above regression would have outperformed the cap-weighted bank index by 8.2% per year from 2000 to 2023. Conversely, a strategy that owned the market cap-weighted bottom decile of ranked stocks would have underperformed the cap-weighted bank index by almost 19% per year from 2000 to 2023. These results are theoretical only and do not incorporate trading costs or liquidity frictions.
The substantial outperformance of our model over such an extended time frame, particularly given the intricacies and volatility of banking equities, underscores the practical utility of composite metrics in identifying profitable opportunities in the banking sector.
Considering the efficacy of the banking model outlined above, it’s worth examining how it would have performed during the banking scare this spring. Surprisingly, the top-ranked decile performed poorly during this period, lagging the market cap-weighted average and the lowest-ranked model decile. Despite demonstrating an overall outperformance throughout our 23-year examination period, the model fell slightly short in predicting bank equity returns during the crisis. The top-ranked decile returned -26% versus the cap-weighted bank group at -23%. Regional banking ETFs, “IAT” and “KRE” returned -28% and -29% respectively over the same period.
Notably, a significant factor contributing to the crisis was the high volume of uninsured deposits at certain regional banks, a risk dimension not directly correlated with the components of our model. Another key element was the exposure of banks to duration risk due to long-maturity bond holdings in a rising interest rate environment, a feature again not encapsulated in our predictive metrics.
Every banking crisis is unique, despite sharing some common characteristics. Generally, some events (e.g., rising interest rates, increasing defaults in parts of the economy) cause investors and depositors to lose confidence in certain banks, resulting in withdrawals. In this specific case, banks that had significant unrealized losses on long-duration assets and banks with a high percentage of uninsured deposits were most exposed. The evolution of digital banking resulted in an unprecedented velocity of withdrawals and a liquidity crunch that was insurmountable for the likes of Silicon Valley Bank. The relationship between uninsured deposits and year-to-date performance is outlined in Figure 6.
Figure 6: Uninsured Deposits vs. Returns (3/1/2023 – 6/30/2023)
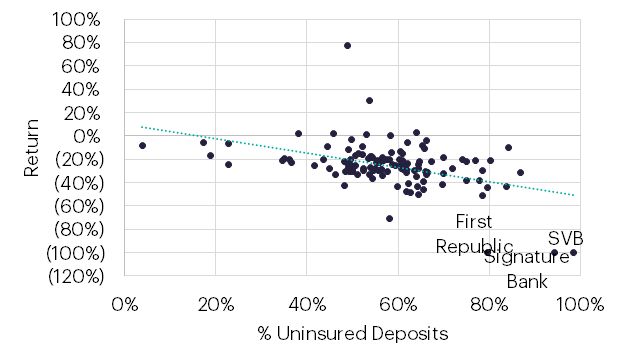
Source: Capital IQ, Verdad analysis. Includes 136 US-listed banks with market caps over $1B as of 12/31/2022.
Despite our model's robustness in predicting returns based on historical trends, it could not anticipate the deposit flight from many regional banks. This underscores an enduring issue for quantitative investors: the shifting sands of market dynamics can render even historically dependable trends useless in the face of novel data.
Regardless, over the long run, basing investment decisions on quantifiable criteria with a long track record of demonstrated success seems prudent to us. A strategy that buys cheap, high-quality banks with conservatively managed loan and asset books can be expected to deliver excess returns in the majority of market environments. We can’t say definitively that this basket of banks will outperform in all future banking crises. However, we believe a portfolio of cheap, high-quality, conservatively managed banks should provide an adequate margin of safety to weather the crisis du jour.
Carolina Bartunek, a rising junior at Harvard College, is pursuing a major in economics with a minor in computer science. Beyond the classroom, she is the president of Harvard’s Investment Association and a published HBS case study writer. Next summer, Carolina is eagerly anticipating her internship at Goldman Sachs’ New York office and participating in the Gran Fondo cycling race.
Joe Ewing is a rising junior at Harvard College. He majors in economics (maybe French too, stay tuned) and is a distance runner on Harvard’s Varsity Track & Field Team. Joe holds the second fastest 1500m time in Harvard history and runs a 3:58 mile. Next summer, he'll be interning at Morgan Stanley in Sales & Trading.