Trade Wars and Japanese Equities
The biggest victim of Trump’s tariffs so far has been the Chinese stock market. The Shanghai Composite is down about 20% this year. But fears of trade war escalation have not left Japan unscathed, with the TOPIX down 9% for the year.
Japan’s export-intensive industrials and materials sectors have experienced the deepest losses. Below, we chart the year-to-date performance of Japanese stocks through July 5 by industry (July 5 was the trough for the Japanese market).
Figure 1: Japanese Equity Price Performance by Industry (31 Dec 2017—5 July 2018)

Source: Capital IQ, available MSCI Japan Industry Indexes.
What’s interesting about this chart is that this year’s worst-performing industries (construction, machinery, metals, and auto components) have been the stars of Japan’s equity market over a longer horizon. From year-end 1999 through year-end 2017, these four industries as a whole outperformed the average of all industries by ~4x.
We would argue that these unsexy industries have done so much better than the broader Japanese market over the long haul, not because there is anything unique about the industries per se, but because these industries have traditionally traded at a significant discount to the broader market.
Figure 2: Japanese Median Industry Valuation vs. Select Industries (LTM TEV/EBITDA)*

There is also a far greater number of investable stocks in these industries on average than in other industries, giving stock pickers a broader selection of opportunities. Those four industries represent just 6% of Japanese industries, but they contain 20% of the approximately three thousand public companies in the Japanese market with a market cap over $50M.
Figure 3: % of Companies in Construction, Machinery, Metals, and Auto Components*

Investors are constrained by their opportunity set, and one of the most interesting things about the Japanese market is the abundance of opportunities in the small- and micro-cap space. Below, we have charted the valuation spreads by percentile within the Japanese market for all companies below $2B in market cap versus companies above $2B in market cap.
Figure 4: Valuation Spread Percentiles for Small and Large Companies in Japan over Time*

As you can see, there is a much broader valuation spread in small caps than large caps. If you want to buy the cheapest stocks in Japan, you have to be willing to invest in the sub-$2B market cap range—and thus accept the liquidity and capacity constraints associated with the small-cap end of the market.
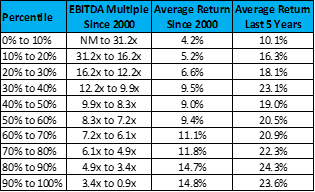
And we believe these valuation spreads matter. Below we show the returns on all Japanese equities by decile from most expensive (top row) to cheapest (bottom row) over the last 17 and last five years.
Figure 5: Returns of Japanese Equities by Valuation Percentile*
We believe that as a result, small value has had a very different risk and return profile in Japan compared to the broader index.
Figure 6: Peak-to-Trough and Trough-to-Peak Total Returns in Japan

Source: MSCI Japan Indices, Total Returns.
Our Japan fund has navigated these recent stormy waters with aplomb. Our fund remains up 1.4% net of fees for the year through July, outperforming the Nikkei, the TOPIX, and the MSCI Japan Small Value Index each by a range of 100 to 500 basis points.
While we are happy to make money and generate alpha in a down market, we continue to believe that the Japanese market as a whole is significantly mispriced. The market has sold off on fears about escalated US tariffs on Chinese and Japanese exporters. Meanwhile, in July, the Abe administration signed one of the biggest free trade agreements since NAFTA. Japan is taking the opposite strategic approach to Beijing’s retaliatory tariffs by seeking instead to phase out trade barriers on Japanese auto imports. And business confidence among Japanese manufacturers hit a seven month high in August despite the trade wars.
The political tensions and Tweet storms du jour may or may not cause future fundamentals to deteriorate in select export industries in Japan. But the 20% pullback in export sectors in Japan implies deeply bearish consensus expectations—a consensus forecast that we are delighted to bet against.
*Source: Capital IQ. All publicly listed equities on June 30 of each year over $50M in market cap. Excludes capital markets, banks, and REIT securities.