Beating the S&P 500
Over the past five years, the S&P 500 has outperformed most of the major asset classes, from bonds to private equity.
Figure 1: 5-Year Returns by Asset Class

Source: Cambridge Associates, HFRI, CapitalIQ
Over a longer, 25-year period, three of these asset classes have outperformed the S&P 500: venture capital, private equity, and small value stocks.
Figure 2: 25-Year Returns by Asset Class

Source: Cambridge Associates, HFRI, CapitalIQ
Warren Buffett famously announced that he would put his family trusts in the S&P 500 index fund—and bet successfully that this simple investment would outperform complex hedge funds. But if an investor wanted to beat the S&P 500 going forward, what investments would have the highest probability of outperformance? Of the three asset classes that have beaten the S&P 500 over long periods of time—venture capital, private equity, and small value stocks - how likely are they to beat the S&P 500 in the future? To answer these questions, we need to explore how each of these three asset classes has returned and what factors have predicted performance relative to the S&P 500 over time.
Let’s start with venture capital.
Venture Capital
The extraordinary outperformance of venture capital shown on the 25-year chart is largely the result of one small window of time—the late 90s tech bubble. Venture has underperformed in all other periods.
Figure 3: Venture Capital over Time

Source: Cambridge Associates
Unless we think the future looks like the late 1990s tech bubble, betting on venture outperformance is probably not a sound bet for beating the S&P 500. We can, with high probability, eliminate venture capital from the list of alternatives likely to beat the S&P 500, absent heroic manager selection or another bubble.
What about private equity, the institutional investor’s asset class of choice?
Private Equity
A recent survey of institutional investors from Preqin found that 49% expect private equity (PE) to outperform the public equity market by a whopping 4% per year or more. Another 45% believe PE will outperform by 2–4% per year. Only 6% of investors think returns will be comparable. The consensus is strong that private equity will outperform the S&P 500, largely because the track record of private equity has been so strong.
However, this consensus has led institutional investors to flood private markets with capital, about $200 billion per year of new commitments. The result is soaring prices for private companies of all shapes and sizes. Just before the financial crisis, in 2007, the average purchase price for a PE deal was 8.9x EBITDA (earnings before interest, taxes, depreciation, and amortization—a common measure of cash profitability). Deal prices reached 8.9x again in 2013 and are now up to past 11x EBITDA.
The major problem with these high valuations is that there has been a strong historical relationship between purchase prices in private equity and the value add relative to the public markets: when prices are high, PE performs in line with or worse than the S&P 500, but when prices are low, PE outperforms. The chart below shows purchase prices by vintage year on the left axis and value add relative to the S&P 500 on the right axis.
Figure 4: Value Add vs. Purchase Prices

Source: Cambridge Associates, Pitchbook
Today, private equity purchase prices are at all-time highs, 20% higher than in 2007. At these prices, to achieve a 60% net debt/EV level, private equity firms are leveraging their deals >6x net debt/EBITDA. The subsegment of private equity deals that historically employed these returns has generated very limited profits. A passive screen of public equities with >6x net debt/EBITDA would have had horrendous performance for the past 20 years. In the graph below, we show the results of a backtest of this expensive LBO strategy from 1999–2016. It shows the estimated return of an equal-weighted portfolio of all liquid, public companies trading at >10x EBITDA with >5x Net Debt/EV based on annual rebalancing.
Figure 5: Backtest of Quantitative Profile of Current PE Vintages

Source: Portfolio123
Private equity firms have benefitted over the last 25 years from a major tailwind: private equities were cheaper than public equities. PE firms were buying small value companies, adding leverage, and selling into higher-priced public markets. But that picture has changed, with private equities now priced at levels equivalent to the public market.
Figure 6: Valuations of Private Equity Relative to the S&P 500
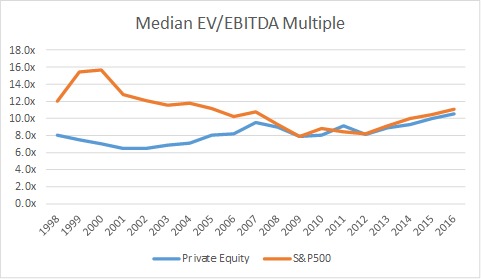
Source: CapitalIQ, Pitchbook
Private equity has gone from being small value on steroids to being more similar to the worst performing of all public equity asset classes—small growth—with the added negative of burdening these small growth companies with large amounts of leverage. For this reason, private equity seems less likely than historically to offer attractive performance relative to the S&P 500.
Small Value Stocks
Private equity historically was an extreme form of small value: both asset classes focused on small, cheap companies. And both asset classes performed exceptionally well. Private equity outperformed small value, especially gross of fees, but this was most likely the result of the significant additional leverage that private equity firms were employing.
Small value stocks are the favorite asset class of academics, because the evidence for small value outperformance has been so strong and so consistent in the data. Since 1965, small value stocks have beaten the S&P 500 over 65% of three-year periods and 84% of five-year periods according to Ken French’s data. This finding helped win Eugene Fama the Nobel Prize and also made him—and David Booth—extremely wealthy through Dimensional Fund Advisors.
The bearish case against small value is the most recent stretch of underperformance. Over the past five years, small value has lagged the small cap market by 1% and the S&P 500 by 3% per year. Below, we compare the performance of large-cap growth stocks to small-cap value stocks over the last three, five, and 10 years to the longer-term 20- and 50-year history. We also show the size and value premiums, defined as the difference between the returns on small and large stocks and value and growth stocks.
Figure 7: Trailing Annualized Performance of Portfolios Sorted by Size and Value

Source: Ken French Data Library
Whereas over the longer term, small value has dramatically outperformed large growth, that has not been true for the last 10 years. This anomalous performance has instilled doubt in even the most confident and successful of hedge fund managers. “The persistence of this dynamic leads to questions regarding whether value investing is a viable strategy,” wrote David Einhorn, in a letter to clients of Greenlight. “After years of running into the wind, we are left with no sense stronger than ‘it will turn when it turns.’”
The outperformance of large growth stocks has driven the valuation spread between growth and value stocks nearly a full standard deviation from long-term averages. The graph below compares the book-market ratio of large-cap growth stocks to the book-market ratio of small-cap value stocks. Over long periods, large growth stocks have traded at about 5x the book-market ratio of small value stocks. Today, large growth stocks trade at about 6.4x the valuations of small value stocks.
Figure 8: Valuation Ratio of Large Growth vs. Small Value

Source: Ken French Data Library
The only other time in recent memory that this divergence has been as wide was in the depths of the financial crisis and the height of the tech bubble. But how predictive is this ratio? We looked at the rolling three-year performance of portfolios divided by size and valuation back to 1949. We divided the periods into quartiles based on the valuation ratio of large growth to small value. The top quartile, which is where the market is today, includes the most extreme gaps between large growth and small value.
Figure 9: Subsequent 3-Year Portfolio Returns Based on Valuation Ratio

Source: Ken French Data Library
Small value’s performance has been more consistent, whereas the performance of growth stocks has depended more on the valuation environment. If past is prologue, then there is now more than an 80% probability of a stretch of significant small value outperformance.
There is robust support for the small value premium. That premium has been replicated through the experience of private equity, and the relative valuation of small value to the rest of the market is in a range that has historically been highly predictive of future outperformance. Therefore, small value seems like a strong bet relative to the S&P 500.