The Waste Land
Biotech is the cruelest sector
By: Greg Obenshain, Daniel Rasmussen, and Anton Wintner, M.D.
This is the second installment of our series on biotech. To read the full white paper, click here.
April is the cruellest month, breeding
Lilacs out of the dead land
––– T. S. Eliot, “The Waste Land”
Biotech stocks lose more often than any others. The median (50th percentile) biotech company has delivered an annualized return of -15% in contrast to the median US company’s 1% annualized return. Since 1996, 67% of US biotechs have had negative cumulative returns versus 48% for all other US companies.
Figure 1: Annualized Company Lifetime Return Distribution 1997–2025
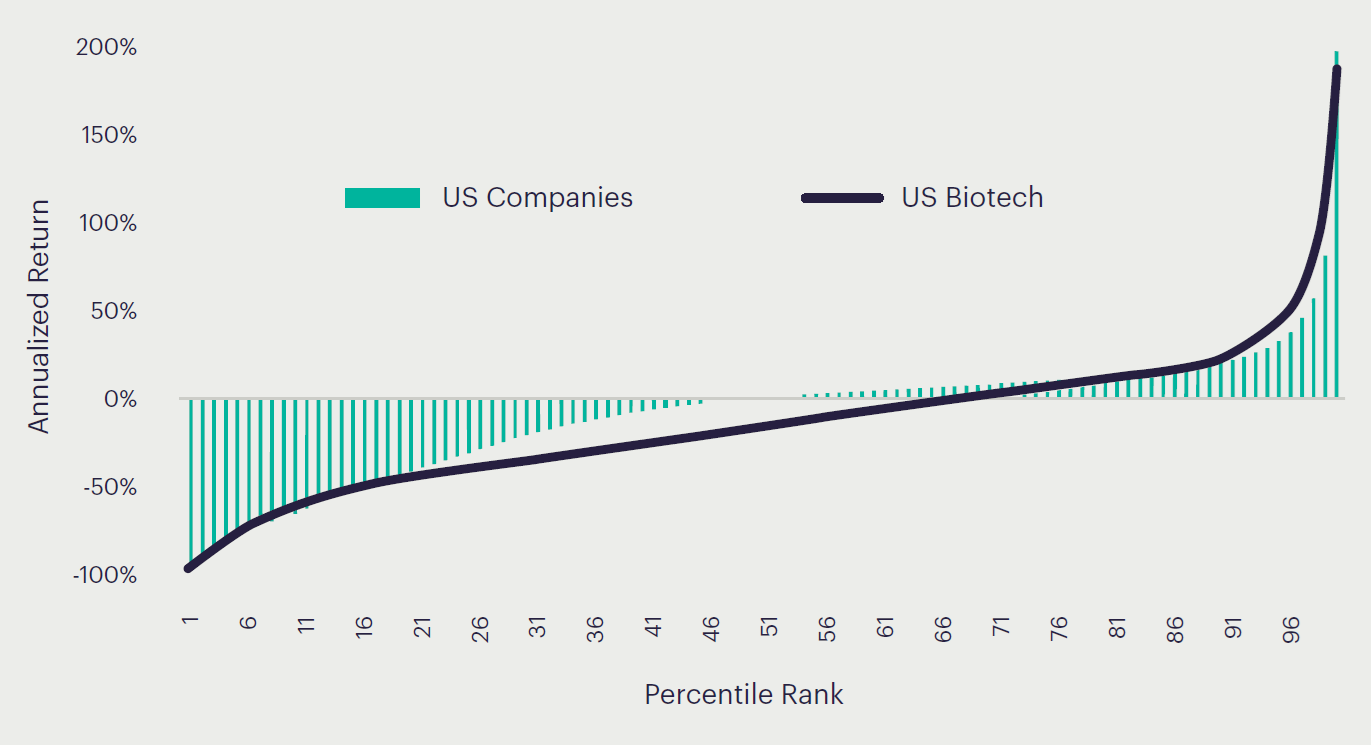
Sources: S&P Capital IQ, Verdad. Companies must have had > $200 million of market cap at one time and greater than 12 months of history to be included. 100th return percentile capped at 200%.
The high failure rate is a feature of biotech’s unique business model. Most biotech companies are, essentially, science projects that investors fund in hopes of discovering a revenue-producing drug.
The sector, therefore, is dominated by companies with no revenue that raise money to fund research. Of companies labeled as biotech by Standard & Poor’s, 69% have no revenue, representing a full 57% of pre-revenue companies in the S&P Total Market Index. Companies without revenue and companies without profit are hard to value. It may seem easier to look away.
But “branches grow out of this stony rubbish,” as Eliot says, and investors ignore this sector at their peril.
Biotech has historically delivered returns. For the 20 years before 2020, the S&P Biotech Index returned 9.3% annually versus 6.1% for the S&P 500 and 7.6% for the Russell 2000. Compensating for the high failure rate and many losing stocks are a few acorns that grow to mighty oaks, big winners that compensate for the morass of mediocre or horrible outcomes.
Biotech is diversifying. Its very strangeness means biotech returns are far less correlated to the market than other sectors. Its average correlation to major industries is below any of the major industry cross correlations.
Figure 2: Sector Correlations with All Other Sectors
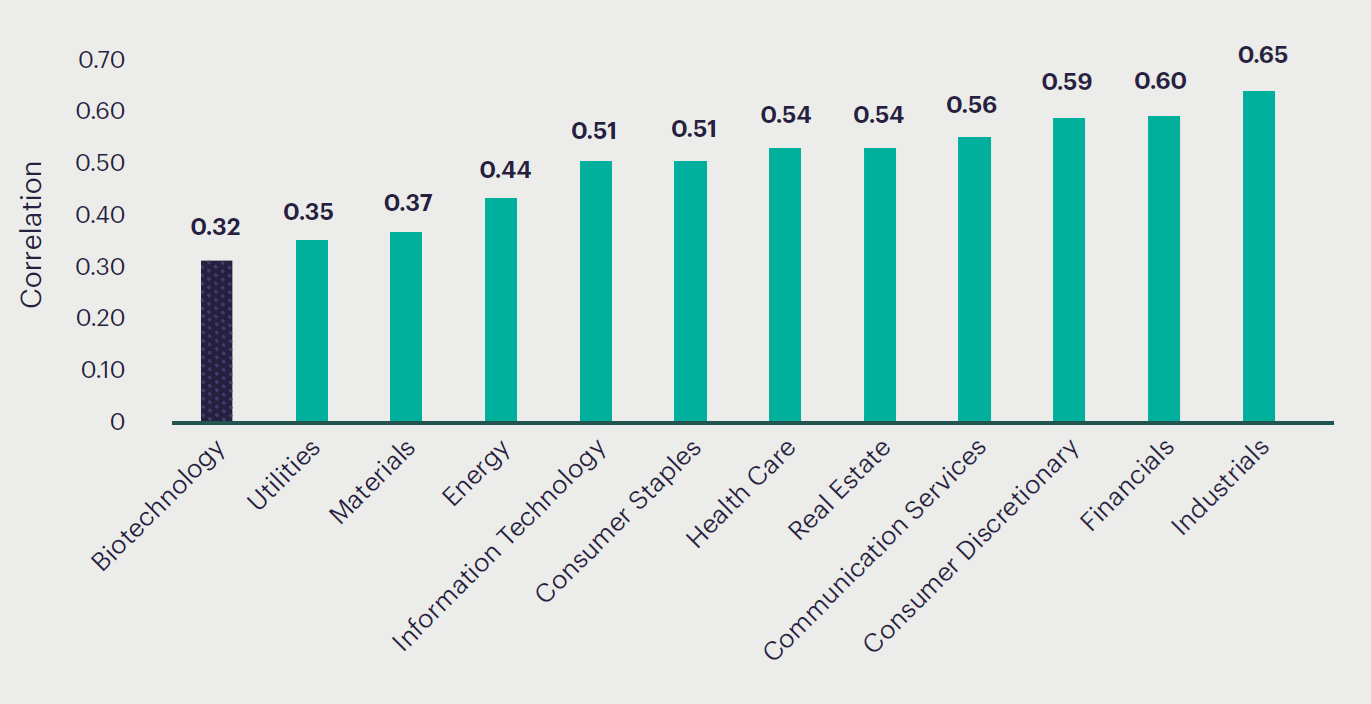
Sources: S&P Capital IQ, Verdad. Calculated as average pairwise correlation with each other industry.
And biotech companies are numerous, especially outside of the large-cap segment. While they represent a small part of the S&P 500, they are a substantial part of the Rusell 2000 and make up over 20% of the smallest companies.
Figure 3: Biotech Company Share of S&P Total Market Index by Market Cap Group
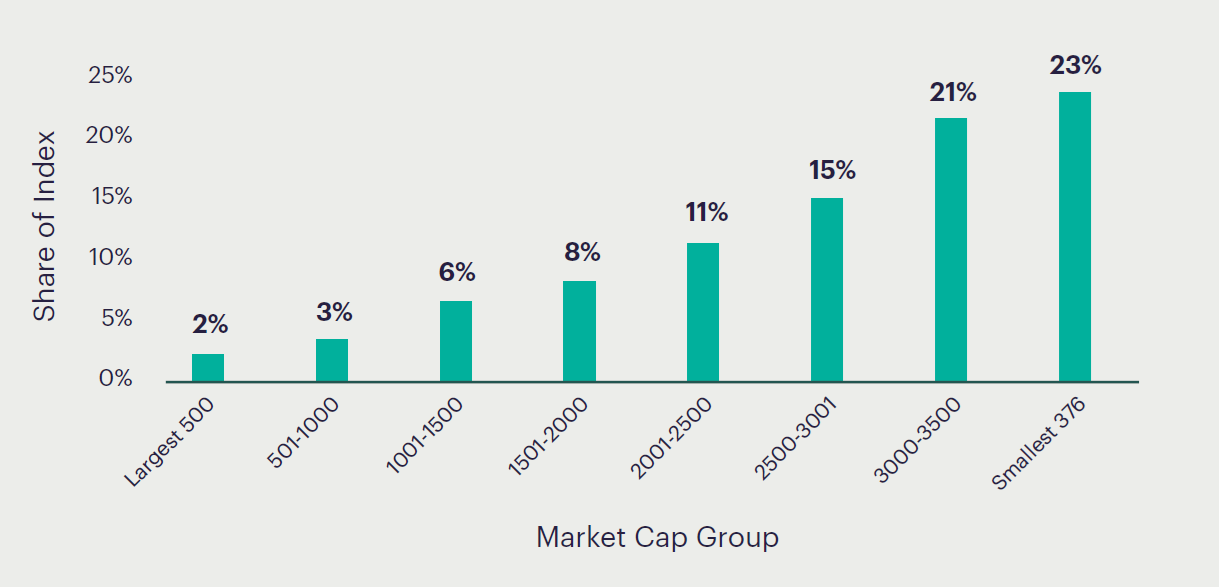
Sources: www.spglobal.com. Industry classifications from S&P Capital IQ. Note: Percent share by market cap is nearly identical.
An industry that historically delivers returns, has low correlation to other investments, and represents a substantial portion of investments should not be ignored. And for quantitative investors, biotech has two very attractive attributes that make it especially useful for constructing portfolios.
First, it has the most companies with which to build portfolios, more than any other sector. It makes up the largest share of the S&P Total Market Index, accounting for over 400 companies (~11%). The next largest sector, banks, has a little over 300 (~8%), followed by software (~5%).
Second, because major biotech outcomes result from scientific breakthroughs and acquisitions from big pharma, rather than the more quotidian business cycles that drive other sectors, the internal correlation of stocks within the sector to one another is much lower than other industries.
Figure 4: Correlation of Stocks Within Each Sector
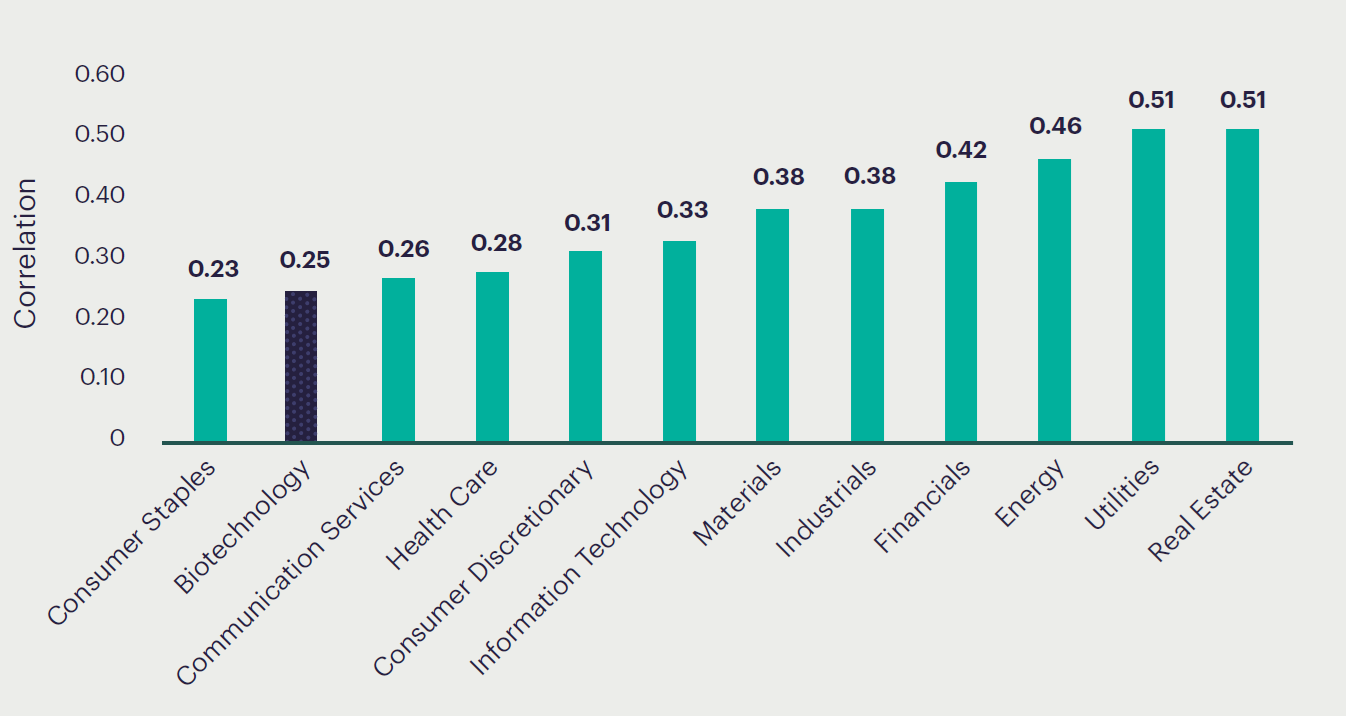
Sources: S&P Capital IQ, Verdad. Calculated as average pairwise correlation of 12-month stock returns.
Low internal correlations mean that diversification can provide more risk reduction than in other industries, though risk models need to be trained on biotech-specific data to capture these internal variations.
As quantitative investors, industries with many names, low correlations to other industries and low internal correlations are particularly attractive. Quantitative approaches work best when they can benefit from diversification. Industries where there is ample opportunity to profit from shorts also help to diversify and isolate profitable factors.
We find ourselves drawn to the opportunities in biotech but deeply aware of its dangers. After all, can a quantitative approach work in a sector with idiosyncratic successes that are not reflected in the financials until years after the value is known? We have spent the past year exploring this question, and we believe we have found a reliable quantitative guide to investing in the sector.