The Sages of Wall Street
Understanding where growth forecasts are accurate and where they err
By: Brian Chingono and Greg Obenshain
Last week, we showed that past earnings growth does not predict future earnings growth. When earnings growth is measured over long horizons, there is little to no evidence of persistence beyond chance, even among the high-fliers that have grown the fastest in the past.
But of course, investors don’t simply look in the rearview mirror when projecting future earnings growth. They also evaluate additional information, including interviews with management, studies of firms’ competitive landscapes, and forensic reviews of any clues that are hidden in the footnotes of firms’ financial statements.
But how good are security analysts at predicting growth? In the paper we referenced last week by Chan et al. (2001), the authors state that “it is commonly suggested that one group of informed participants, security analysts, may have some ability to predict growth. ... Over long horizons, however, there is little forecastability in earnings, and analysts’ estimates tend to be overly optimistic.”
We tested this finding for ourselves and came to a similar conclusion, as shown in the table below. Using a database of all US stocks from 1997 to 2021, we measured the median analyst estimate for growth over the next two to three years across a range of earnings metrics. We then compared these forecasts against the actual median outcomes over the next two to three years. While the estimated and actual growth rates in the table below are annualized for simplicity, the error is shown on a cumulative basis to reflect the magnitude of the mistakes at the end of each horizon.
Figure 1: Analyst Forecasts vs. Actual Growth (1997 – 2021)
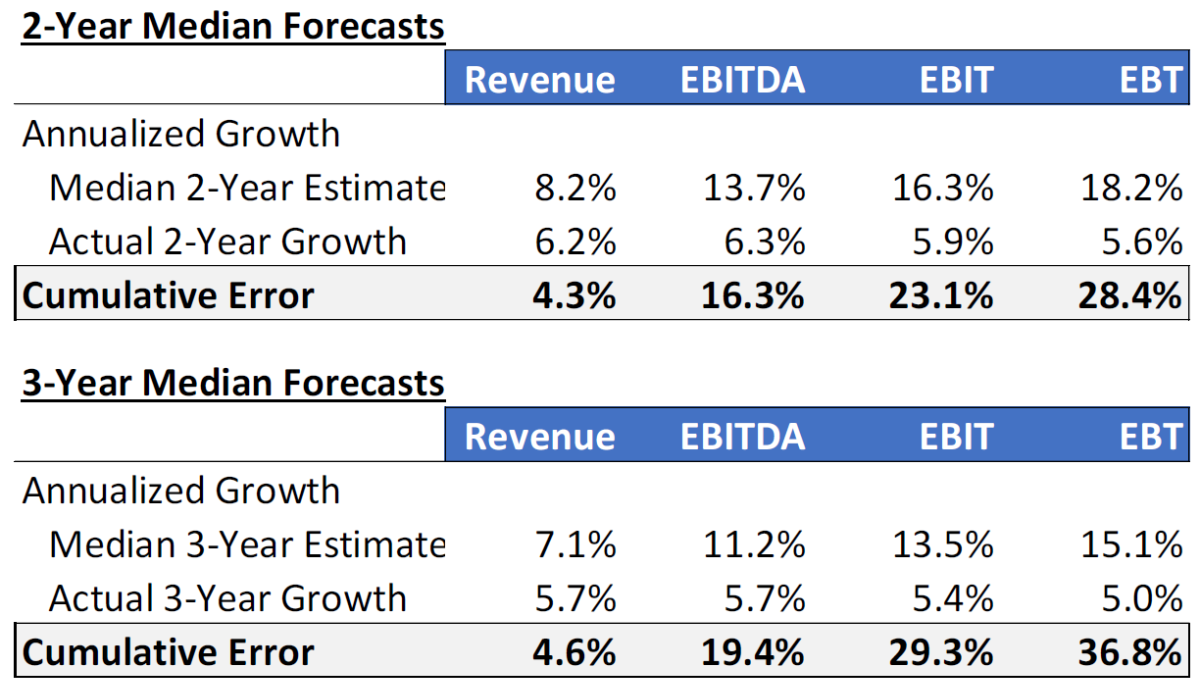
Source: S&P Capital IQ and Verdad research
Across the board, these results seem to confirm Chan et al.’s conclusion about the optimism of analysts’ forecasts since the estimated growth rates systematically overshoot the actual outcomes. Importantly, analysts’ forecast errors seem to be bigger precisely in the areas that should matter most for stock prices: earnings further down the income statement that go to equity investors, and earnings further out in time.
While analyst estimates of future revenue are relatively close to actual outcomes, their accuracy deteriorates considerably as you move further down the income statement toward measures like Earnings Before Tax (EBT) that better reflect the earnings that are available to equity investors. And in each case, the cumulative error widens as you move further out in time from two years to three years in the future.
What if we replaced the analyst forecasts with a naïve estimate that corresponds with long-term GDP growth? Since 1947, US GDP growth has averaged 6.3% per year on a nominal basis (including inflation of around 3.5% per year). In the table below, we show the cumulative errors from forecasting 6.3% annualized growth for every company, compared to the cumulative errors from analyst forecasts.
Figure 2: Cumulative Errors from Analyst Forecasts vs. Assuming GDP Growth (1997 – 2021)
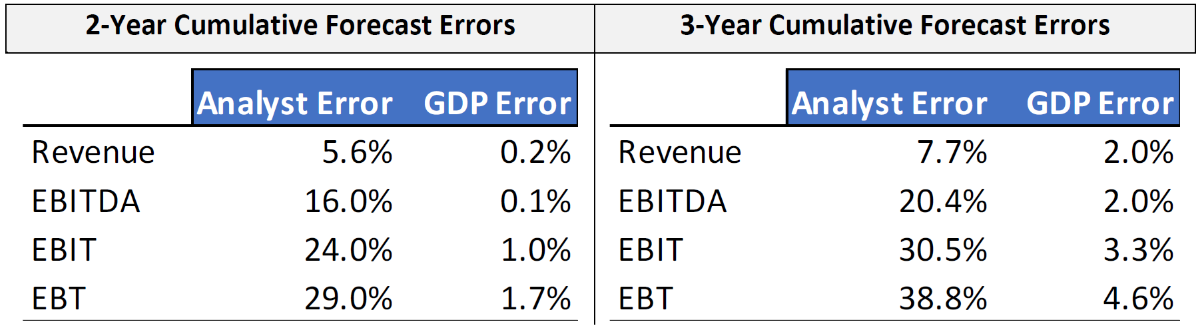
Source: S&P Capital IQ and Verdad research
It turns out that the naïve estimate of GDP growth is much more accurate, on average, with the median error being within a few percentage points of the actual outcome. On the other hand, analyst forecasts tend to overshoot the mark by 20–40% on average, when predicting earnings over a two- to three-year horizon.
This finding confirms Chan et al.’s observation that “it is difficult to see how the profitability of the business sector over the long term can grow much faster than overall gross domestic product.”
Fair enough, but fundamental investors might object that they don’t invest in average companies. What we want to understand is the distribution of forecasts versus actual results. Are analysts effective at separating high- and low-growth firms more broadly?
And here, we find some evidence of analyst forecasting skill. Below we show a table where we sorted analysts’ estimates of revenue and EBITDA growth into quintiles, and actual growth outcomes into quintiles. We then evaluate how accurate analysts are at selecting which growth quintile a company belongs to.
An accurate prediction would be a company where analysts expect top quintile growth, and actual growth over the next three years is indeed in the top quintile. These accurate predictions are tagged with a one in our data, and all other outcomes are tagged with a zero. The average of this binary column gives us the sorting accuracy of analyst forecasts. As shown in the table below, analysts are up to 50% accurate in the highest-expectation quintile, whereas they are around 30–40% accurate in other forecast quintiles, a significant improvement over random chance (20%).
Fig 3: Analysts’ Accuracy in Sorting Firms into 3-Year Growth Quintiles (1997 – 2021)
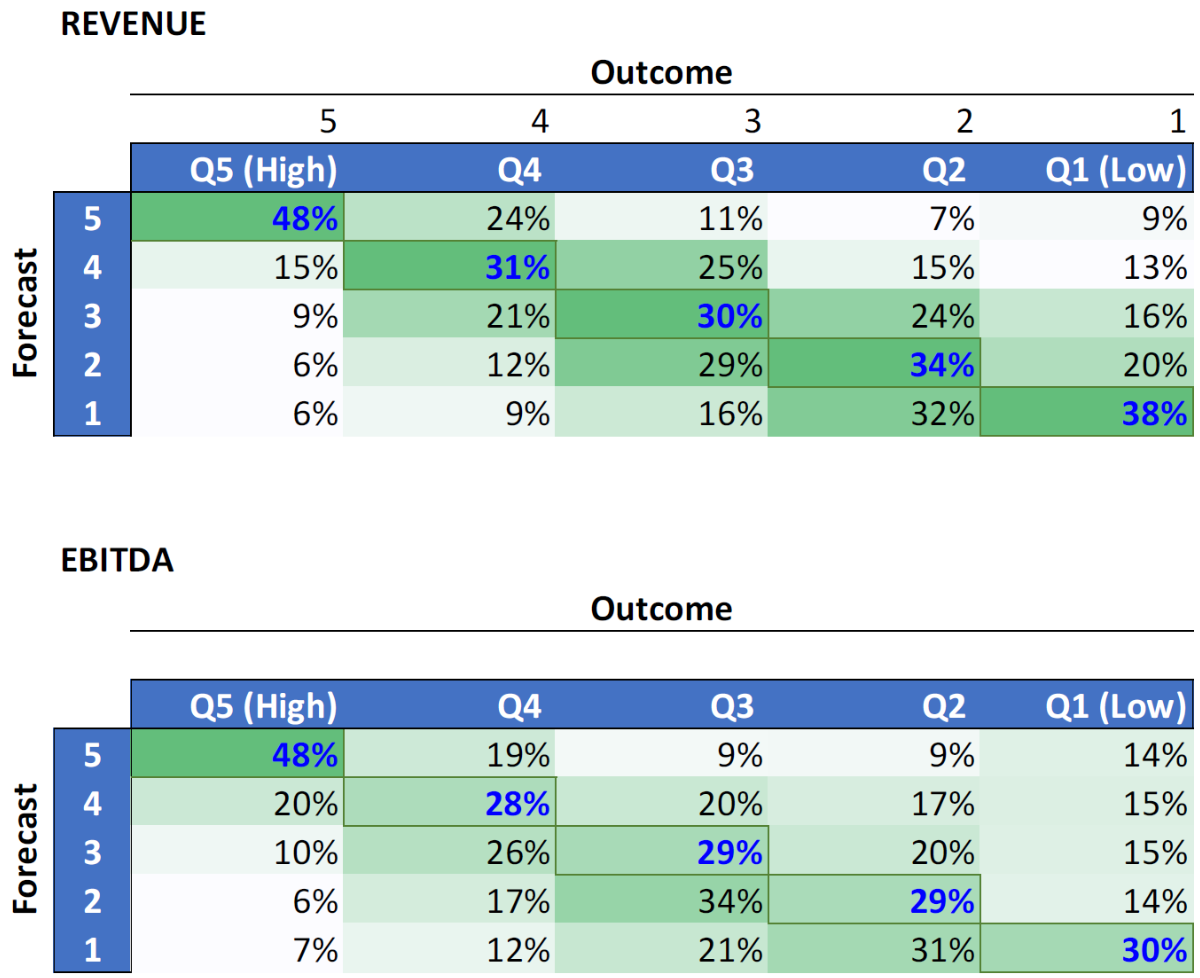
Source: S&P Capital IQ and Verdad research
Some readers objected last week to our quip that analysts might as well assume the same growth rates for SaaS software companies as coal miners. This table does suggest that when analysts forecast top-quintile growth, they’re accurate 50% of the time, and when they forecast bottom quintile growth, they’re accurate 30–40% of the time, which is far better than random chance and suggests that analysts are basing their forecasts on some good signals.
But there’s a wrinkle to this analysis.
If a stock is richly priced because analysts expect 20% annualized earnings growth over the next three years, investors in that firm generally won’t earn a significant return premium unless its realized earnings growth exceeds 20% per year. On the other hand, if realized growth comes in at 10% annualized, the price decline could be catastrophic, as investors have seen when the pandemic-era “stay-at-home” trades like video conferencing and home exercise reversed dramatically in 2022. So we really care about the errors relative to the forecasts.
In the table below, we show median three-year forecasts and outcomes within each quintile of analyst expectations. The results indicate that analysts are generally directionally correct (the highest-expectation stocks grow faster than the lowest-expectation stocks), but the errors are significantly bigger in the higher-expectation quintiles than the lower-expectation quintiles, and errors are also significantly bigger the further down we look on the income statement.
Figure 4: Quintiles of 3-Year Analyst Forecasts (1997 – 2021)
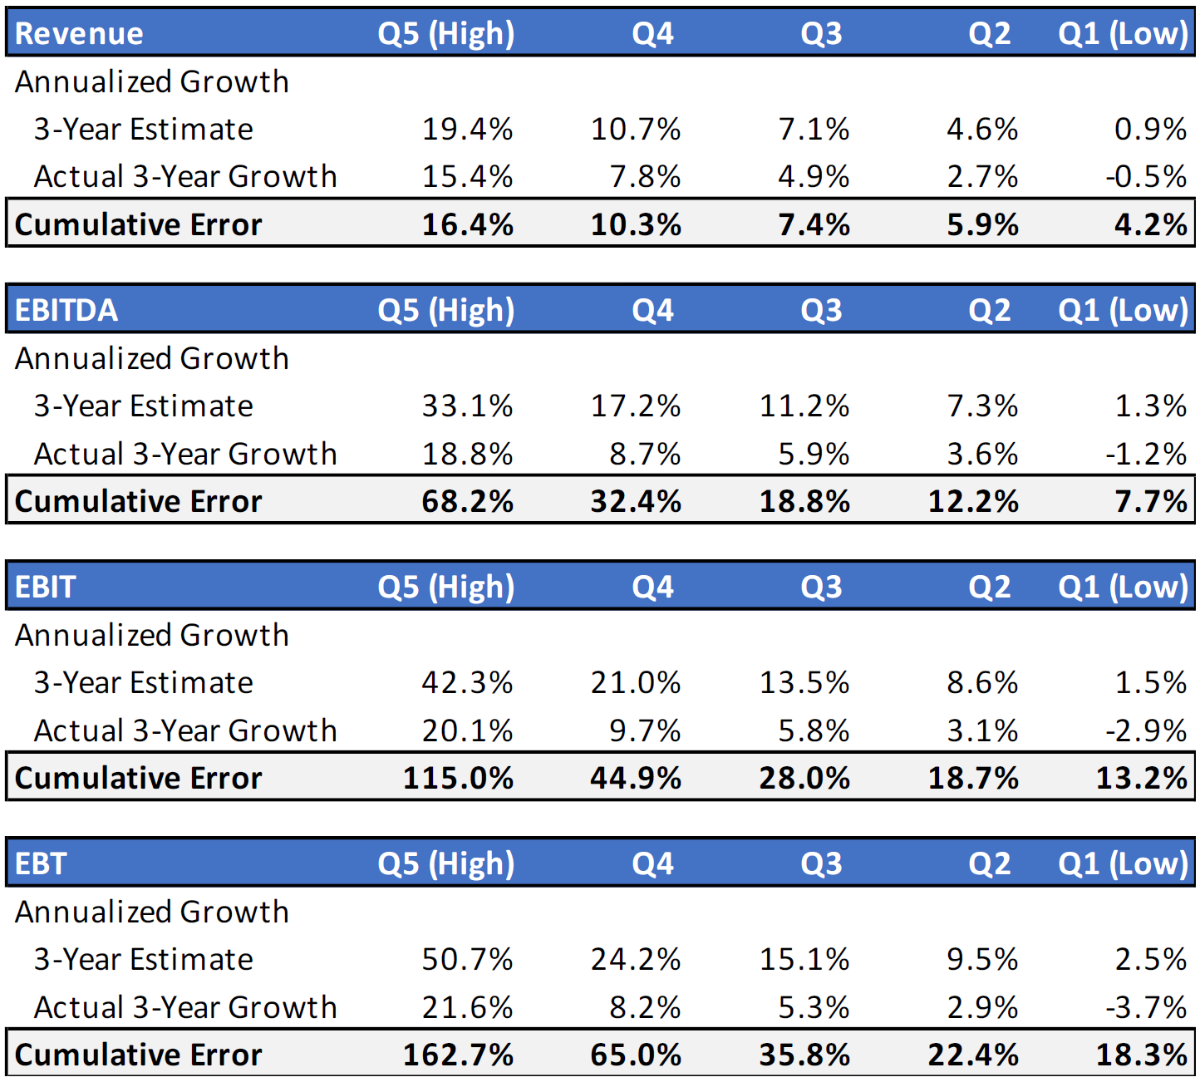
Sources: S&P Capital IQ and Verdad research
This analysis provides a tidy logic for value investing. Value investing works because stocks with low growth expectations priced in are less likely to disappoint dramatically. It’s one thing to miss the three-year EBITDA estimate by 8% in a cheap company that’s already priced for slower growth than inflation. It’s quite another scenario to miss the three-year EBITDA estimate by 68% in a company that’s priced to grow 5x faster than GDP. And, as you’ll recall from Figure 2, about two-thirds of the companies assigned by analysts to the lowest-expectation category end up delivering positive surprises over the next three years.
Perhaps these results simply reflect human bias toward overconfidence, and more accurate predictions could be made by algorithmically weighting metrics from the financial statements? After all, the superiority of mechanical (statistical) predictions over clinical forecasts has been well documented across a range of disciplines in numerous studies. In the next installment of our research series, we’ll explore whether better growth forecasts can be made using quantitative measures.