Predicting Growth
Short-term growth is predictable, but that is less useful than it seems
By: Greg Obenshain and Brian Chingono
Two weeks ago, we extended the 2001 findings in the paper The Level and Persistence of Growth Rates through June 2022 and confirmed that, indeed, there is no persistence in long-term earnings growth beyond chance. The chart below shows this graphically. The straight black line at the top is what we’d expect if growth perfectly persisted, meaning that companies that were above the median growth rate in year 1 were again above that rate in years 2, 3, 4 and 5. The gray line is what we would expect if growth does not persist at all, meaning that a company that was above median growth in year 1 had a coin flip of a chance at being above median growth in year 2, so that that probability of being above median growth for two years in a row is 25% and just 3.215% for five years running. The blue line is Chan et al.’s original finding from that paper and the dotted black line is ours.
Figure 1: Percentage of Firms with Above-Median EBITDA Growth Each Year for Number of Years
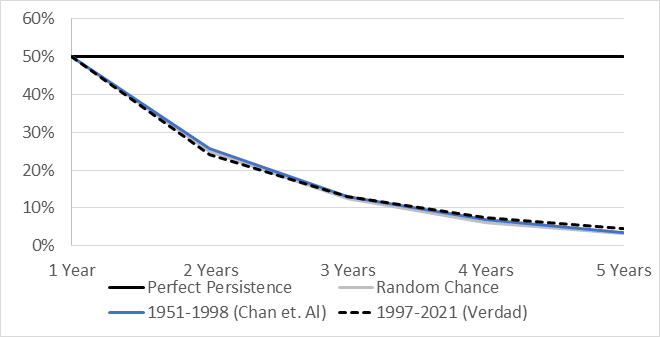
Source: Chan et al., S&P Capital IQ, Verdad Research.
If you are having trouble distinguishing between Chan et al.’s results, Verdad’s results, and random chance, well, that’s the point. While it would be absurd to believe in perfect persistence, the straight line, what is surprising is just how close to the random chance the actual data falls.
This result led us to quip that analysts might as well plug in the same long-term growth assumptions for a SaaS company as a coal mine. And we stand by this. The data shows that we need to be very humble when plugging a terminal growth assumption into a discounted cash flow model. A good assumption is the GDP growth rate.
But the observation that growth rates do not persist is not the same as saying they are not predictable in the short run. And last week we showed that, while analysts are wildly over-optimistic in their growth estimates, they do, in fact, sort companies correctly into the high and low growers. While it may indeed be true that growth does not persist, surely we can predict with some confidence that the IT services firm with a growing customer backlog is likely to grow faster next year than the auto parts supplier who just lost their largest contract.
So can we make some reasonable predictions about growth? One way to do this is just to select those variables that have predicted growth in the past. When we run regressions on EBITDA growth, the three variables that are most significant and have the highest magnitude of impact are, in order, analyst expected EBITDA growth, followed closely by both the trailing improvement in the TEV/EBITDA multiple and trailing EBITDA growth.
We can build a simple growth factor that equal weights these three variables. And this factor works very well to predict the relative magnitude of short-term growth. Below we show the same persistence chart, except this time we show the persistence of growth for the top quintile of our growth factor and the bottom quintile of our growth factor. The black line is again random chance.
Figure 2: Firms with Above-Median EBITDA Growth Each Year for Number of Years
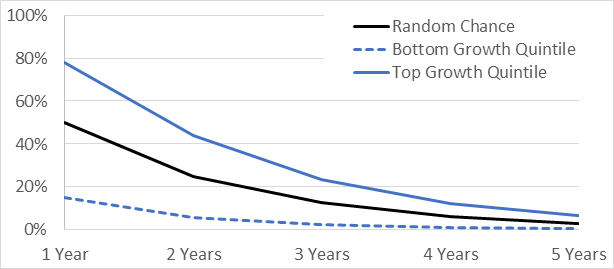
Source: S&P Capital IQ, Verdad Research. Data from 1997 to 2021.
78% of top-quintile companies by our growth measure are above the median growth rate in year 1, and 44% are again in year 2. This is far better than random chance and a slight improvement over analyst projections alone. Conversely, just 15% of the bottom-ranked companies are above median growth in year 1, and 6% are again in year 2. In fact, it isn’t until year 5 that we’re back to random chance (but it is notable that we do converge back). This is a very promising result and a victory for the short-term predictability of growth.
But, alas, there is a problem: predicting growth isn’t the same as predicting returns. And it turns out that our growth prediction is actually negatively correlated with total returns. Below we show the realized EBITDA growth by predicted growth quintile and the realized total return.
Figure 3: High EBITDA Growth Does Not Translate to High Stock Returns
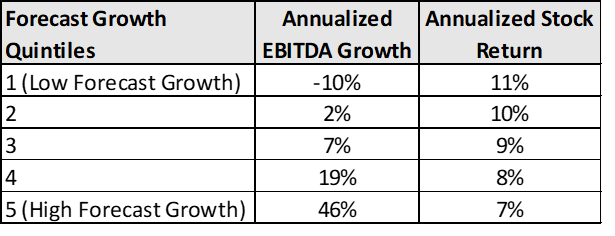
Source: S&P Capital IQ, Verdad Research. EBITDA growth is EBITDA weighted. Returns are market-cap weighted. Data from June 2001 to June 2022.
What on earth is going on here? Growth should be the major driver of equity returns. And our simple growth forecast works well at predicting EBITDA growth. And yet the highest EBITDA growth results in the lowest returns.
The key to understanding this apparent paradox is to decompose total returns into the contributions of growth, changes in multiple, leverage, and distributions. The below chart shows the total returns of each quintile of our growth prediction broken out into these categories.
Figure 4: Return Decomposition for Forecast Growth Quintiles
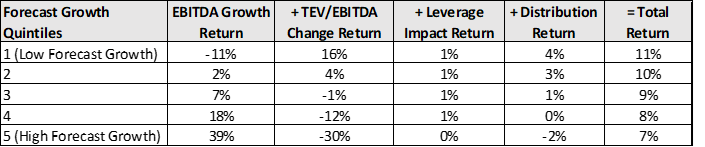
Source: S&P Capital IQ, Verdad Research. Return components are fundamentally weighted. Data from June 2001 to June 2022. Distribution return includes changes in net liabilities, dividends and share buybacks.
The data above suggests that while firms with high forecast growth indeed grew at impressive rates, they also experienced the greatest contractions in their multiples. In fact, the same three factors that predicted growth—analyst forecast EBITDA growth, improvement in the TEV/EBITDA multiple, and trailing EBITDA growth—were the exact same factors that predicted multiple contraction. In addition, the firms with high forecast growth had negative distributions, which result from debt and equity issuance and cash usage. As a result, higher growth net of capital consumption for these firms was more than offset by higher multiple contraction.
This is the cruel result of a lack of persistence in growth. Valuation multiples contract because growth does not persist. In fact, the lack of dispersion of returns between the high growers and the low growers points to the efficiency of markets. Growth is more or less correctly priced. And that’s what we’d expect. As every good analyst learns, it’s not the forecast that matters, but the forecast relative to what is already priced in.
Stocks that price high growth are particularly susceptible to multiple contraction. So an analyst building a DCF model should remind themselves that the higher the growth rate, the lower the exit multiple relative to the entry multiple should be. Analysts should assume that growth mean reverts to the market within five years. This is the argument we have made from the beginning and an eminently reasonable approach, even for the fastest growers, as we showed in Figure 2. To give a sense of what this should look like, we provide a cheat sheet below. For each projected growth quintile, we show the starting annualized two-year growth projection and the subsequent realized median annual growth rates.
Figure 5: Base Rates: Projected vs. Actual EBITDA Growth Rates
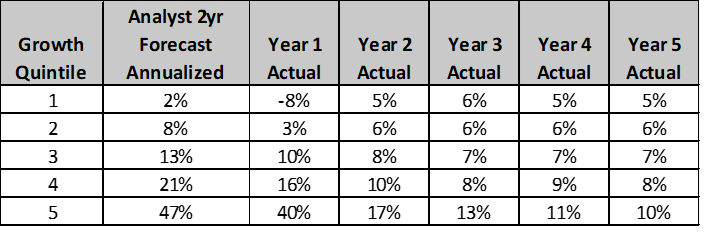
Source: S&P Capital IQ, Verdad Research.
The data in this chart is counterintuitive. Not because the high growth forecasts are too optimistic, but because they fade so quickly. We suspect that this historical base rate chart is far from what many investors hold in their head. But we also suspect that if we choose to replicate this data 20 years from now, the results will look eerily similar.
We’ve spent three weeks now looking at growth, only to come to the conclusion that predicting growth well doesn’t lead to being able to forecast total returns any better. Next week we plan to look at what fair multiples should be for a terminal value assumption and why some companies deserve higher valuations, independent of their growth rates.