The Next Decade in European Value
Europe appears to be priced for significant value outperformance over the next decade. To fully capture this value premium, we believe investors should also have some exposure to developing economies in Eastern Europe.
European small value stocks have had an impressive run over the past year, up 68% over the 12 months ending March 31, 2021, compared to a 39% return among European large growth stocks.
Figure 1: One-Year MSCI Index Performance (March 31, 2021)
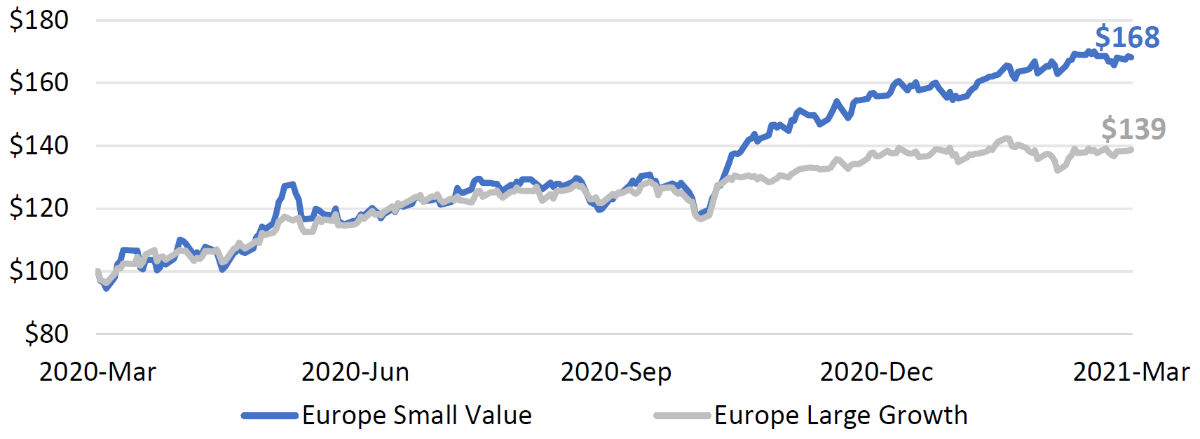
Source: MSCI
With small value having outperformed large growth by 29 percentage points over the past year, some investors without a European small value allocation may be wondering, “Did I miss it?”
Based on the long-term evidence, we think the answer is an emphatic “No.” After a decade of drought, we believe value companies are currently priced at such extremely low levels that the next decade could potentially be the mother of all reversals in favor of value.
We believe there are a couple of things working in Europe’s favor today. First, Europe trades at a 25% discount to the US, based on P/E ratios. Second, Europe offers diversification benefits through a mix of mature economies in Western Europe and the Nordics, alongside developing economies in Eastern Europe that trade at a significant discount to their peers.
Figure 2 below sets the stage with historical context in Europe over the past 45 years, covering the full period of available data from Ken French’s library since 1975. Panel A shows the annual spread in valuations between cheap stocks and expensive stocks, defined as the price/book ratio of the value portfolio divided by the price/book ratio of the growth portfolio. For context, the average level of this spread is shown in the red horizontal line, and the green lines denote two standard deviations from the mean (i.e., extreme distances from the average). And Panel B below shows the spread in forward 10-year returns at each point in time since 1975, defined as the 10-year forward return of value stocks minus the 10-year forward return of growth stocks.
We can see evidence of mean reversion in Panel A, as value stocks have often delivered their strongest outperformance following periods when relative prices have dropped below their historical average. The troughs in relative prices in 1983, 1993, and 2000 were followed by annualized value outperformance of 4.9%, 10.3%, and 11.8% respectively over the next 10 years.
Figure 2: Valuation Spreads and Return Spreads (Jan 1975 to Mar 2021)


Source: Ken French website
Notice that the endpoints of the above charts are related. In 2020, value stocks in Europe reached their cheapest level of relative valuation in recorded history. And this opportunity exists because value stocks are now digging out from their worst decade of relative performance on record since 1975. Evidently, there is a lot of room for value stocks to run over the next decade as today’s extreme spreads revert toward their historical averages.
So how should investors position their Europe portfolio to maximize exposure to this value opportunity? As shown in the figure below, there is significant variation in valuations across countries within Europe. In the analysis below, we took the European countries with investment-grade sovereign ratings and we ranked those countries by their median equity valuations using a combination of price/book and EV/EBITDA ratios.
The countries on our list are based on a broad definition of Europe that combines Continental Europe (which has 40% of its landmass in Russia) with the island nations of the UK and Ireland. Perhaps the surest indication that these countries belong to the same “family” can be seen in their history of economic cooperation and sporadic family feuds.
Figure 3 clearly shows that developing economies in Eastern Europe are a necessary component of a deep value strategy in Europe. Four of the five cheapest countries are in Eastern Europe. Overall, Eastern Europe trades at a 29% discount to Western Europe in terms of price/book and a 41% discount in terms of EV/EBITDA. These Eastern European discounts increase to 54% and 43%, respectively, when compared against the Nordic region.
Figure 3: Valuations by Country in Europe (April 2021)

Sources: Capital IQ, Moody’s Investors Service
As with many of the best opportunities in the market, European deep value is capacity constrained. The chart below shows the same list of countries ranked by their representation in Europe’s deep value universe (defined as the proportion of deep value companies located in each country). Below these blue bars, we show the depth of each market, measured in terms of each country’s share of Europe’s aggregate market capitalization.
Figure 4: Deep Value Representation and Market Depth by Country (April 2021)

Source: Capital IQ. The deep value universe is defined as the cheapest quartile of companies in Europe based on a combination of price/book and EV/EBITDA.
We believe two key points are demonstrated in Figure 4. First, although Eastern European countries like Poland, Russia, and Romania represent a small share of aggregate market capitalization, they contain a disproportionately large share of deep value companies. Overall, Eastern Europe represents 5% of the continent’s market cap, but this region contains 33% of Europe’s deep value companies. The upshot is that meaningful deep value exposure simply cannot be achieved through market cap–weighted indices.
Second, a deep value approach in Europe must be capacity constrained to maximize exposure to the cheapest opportunities across the continent.
With the flexibility to achieve broad diversification by country, and the ability to access cheap opportunities that are priced at historically low levels, we believe that a deep value strategy focused on Europe could be poised for significant outperformance over the next decade, as valuation spreads revert to their long-term average.