The Narrative is Priced In
Last week, we examined some popular narratives about financial markets. We identified three key themes of what’s in vogue: the S&P 500 index, “safe” minimum-volatility stocks like utilities, and high-growth stocks.
This week, we want to show you how we believe that enthusiasm translates into valuations for these stock categories—and contrast those valuations with valuations for deep-value stocks in the US, Europe, and Japan. Let’s start with the S&P 500.
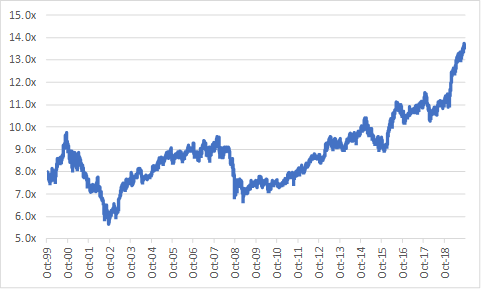
Figure 1: EV/EBITDA of the S&P 500 1999–2019

Source: Capital IQ
According to this data, the S&P 500 trades at valuation multiples 55% higher than the trough during the global financial crisis and the highest levels since the 1999 tech bubble—at an 18% premium to the 20-year median.
The story for utility stocks, which some investors consider to be a safe haven with low volatility and bond-like characteristics, is more frightening. Below we show the same chart for the S&P 500 Utilities Sector.
Figure 2: EV/EBITDA of the S&P 500 Utilities Sector 1999–2019
Source: Capital IQ
According to this data, utilities stocks are trading at all-time highs on EV/EBITDA, at a 36% premium to their 20-year median and a 55% premium to the global financial crisis low. Investors searching for safety have dramatically bid up to highly risky valuations a segment of the market they perceive to be less volatile.
But the most frightening chart of all is of the valuations of the hot and sexy growth stock darlings in the tech industry. Standard & Poor’s only tracks the multiples of software stocks back to 2005, but below is a chart showing EV/EBITDA multiples of the S&P 500 Software Industry.
Figure 3: EV/EBITDA of the S&P 500 Software Industry 2005–2019

Source: Capital IQ
According to this data, the S&P 500 Software Industry is trading at 78% of its median since 2005 and a whopping 373% of the global financial crisis lows.
We believe we have a market where the narrative is priced in. The S&P 500 Index, utilities stocks, and especially software stocks are trading at multiples that are very high relative to history.
Meanwhile, it seems like value stocks and international stocks are trading at much more normal valuations. Contrast the above charts with the below tables showing valuations for US, Europe, and Japan deep value, as measured by the tenth percentile of valuations of those respective markets. We compare current multiples to the 20-year median, max, and min.
Figure 4: Deep-Value Valuations in the US, Europe, and Japan 2000–2019

Source: Capital IQ
This picture is dramatically different. US deep-value stocks are priced at 20-year median levels, 20% below the highs, and at only a 30% premium to global financial crisis lows. European deep-value stocks are priced at 20-year median levels, 44% below the highs, and a mere 23% premium to 2009 lows. Japanese deep-value stocks are priced 30% below their 20-year median, at half their highest valuations, and a mere 22% premium to lows hit during the global financial crisis.
These stocks might be cyclical, GDP-dependent, and suffer in a recession. But if investors have priced that into these stocks, then we believe it’s possible they might actually have less far to fall than the safe utility stocks, the hot software stocks, or even the richly valued S&P 500 Index.
We believe this seems like a reasonable hypothesis when we compare current valuations as of September 30th to the very bottom of the global financial crisis.
Figure 5: Sept 2019 vs June 2009 EV/EBITDA
Source: Capital IQ
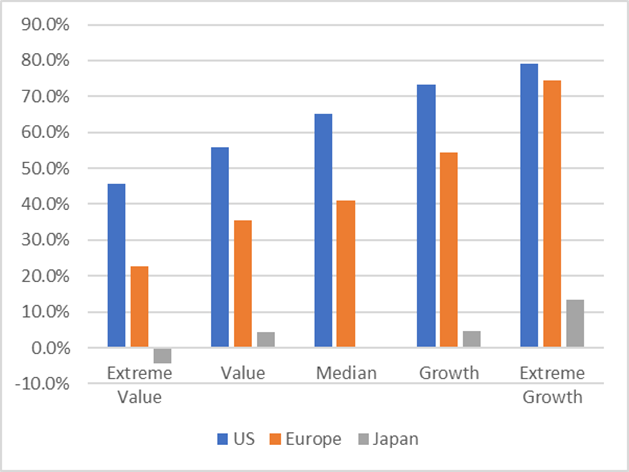
If markets were to trade back to their 2009 levels overnight, there would be roughly 2x the amount of drawdown in growth valuations relative to value from a EV/EBITDA perspective. Japan seems to have already priced in something worse than a 2008 recession, at least in deep value.
Now, it’s important to note that, in 2008, being in value stocks didn’t cushion the fall at all. The MSCI North America Factor indexes all drew down about 50%. But there’s a huge difference between today and 2007’s pre-crisis market. In 2007, the relative expectations for growth stocks were near all-time lows, whereas today, after a decade-long growth stock rally, they are near all-time highs. Below are the relative valuation spreads for extreme-growth stocks divided by deep-value stocks over time. In 2007, growth stocks traded for about 5–6x the price of value stocks. Today, they trade at about 9–11x globally. The expectations for growth in 2007 were much lower than they are today.
Figure 6: Ratio of 90th/10th Percentile Stock Valuations Globally

Source: Capital IQ
Given where spreads are today, a closer analogue might be the dot-com bubble. From March of 2000 to March of 2003, the MSCI North America Small Value index returned +0.45% while the MSCI North America Large Growth index drew down 61.2%. And this occurred over a year or two in which GDP growth trends declined by 500bps, much like the scale of economic growth decline in 2008.
More so than any other segment of the market, deep value appears to have already priced in expectations of bad times while growth appears to have priced in a continued bubble. We haven’t seen markets split expectations so dramatically since the dot-com bubble.
And if investing is a game of meta-analysis, not a game of analysis, then we believe the smart thing to do would be to ignore the dominant narratives around growth stocks, low-volatility stocks, and the S&P 500. And we believe it might be better to instead buy those stocks that are most out of line with the dominant market narrative, where valuations look cheap, downside looks more capped, and upside is significant. After all, as one mentor of ours put it, “it’s hard to get hurt falling out of the basement window.”