Rethinking FX Carry
Exploring tail risk, factor models, and valuation overlays in currency markets
After years of relative dormancy, international currencies are off to their strongest start against the dollar since 1972. Through the end of May, the DXY Index, which tracks the US dollar against a basket of major currencies, is down 8.5%.
For US investors, currencies offer not only diversification but also a potential source of return. With that in mind, we’ve spent considerable time this year building a framework for currency investing, one that goes beyond simplistic yield-chasing and engages with the structural risks beneath the surface.
At first glance, the foreign exchange carry trade looks like free money: borrow in low-yielding currencies, invest in high-yielding ones, and pocket the spread. Economic theory, however, tells a different story. According to Uncovered Interest Rate Parity (UIP), exchange rate movements should fully offset interest differentials, leaving no arbitrage opportunity. Yet in practice, UIP consistently fails. Carry strategies have historically delivered robust returns and impressive Sharpe ratios, rivaling mainstay equity factors like value and momentum.
But carry is not a free lunch. When macro stress and market positioning collide, carry trades can collapse in spectacular fashion—a phenomenon aptly called the “steamroller effect.” To manage this tail risk effectively, investors must understand both the anatomy of FX returns and the hidden risks behind the headline yields.
We can break an FX carry trade into two key components:
Carry: the interest rate differential between the long and short currency
Price return: changes in the spot exchange rate
The first is mechanical. If the Mexican peso yields 10% and the Swiss franc 1%, a long MXN/short CHF trade earns a 9% spread—assuming no price movement. But exchange rates rarely stay put. Policy shifts, macro surprises, and risk-off episodes can drive sharp reversals that quickly wipe out months of accrued carry.
What really matters in FX isn’t just volatility, but skewness—how returns behave in the tails:
Investment currencies (high yielders like MXN or BRL) tend to have positive expected returns but negative skewness, occasionally suffering large drawdowns.
Funding currencies (low yielders like JPY or CHF) tend to have negative expected returns but positive skewness, providing rare but significant gains during market stress.
These patterns are clearly visible in Figure 1, which summarizes excess return moments for major currencies, including mean, standard deviation, skewness, and kurtosis.
Figure 1: FX Excess Return Moments (1996–2025)
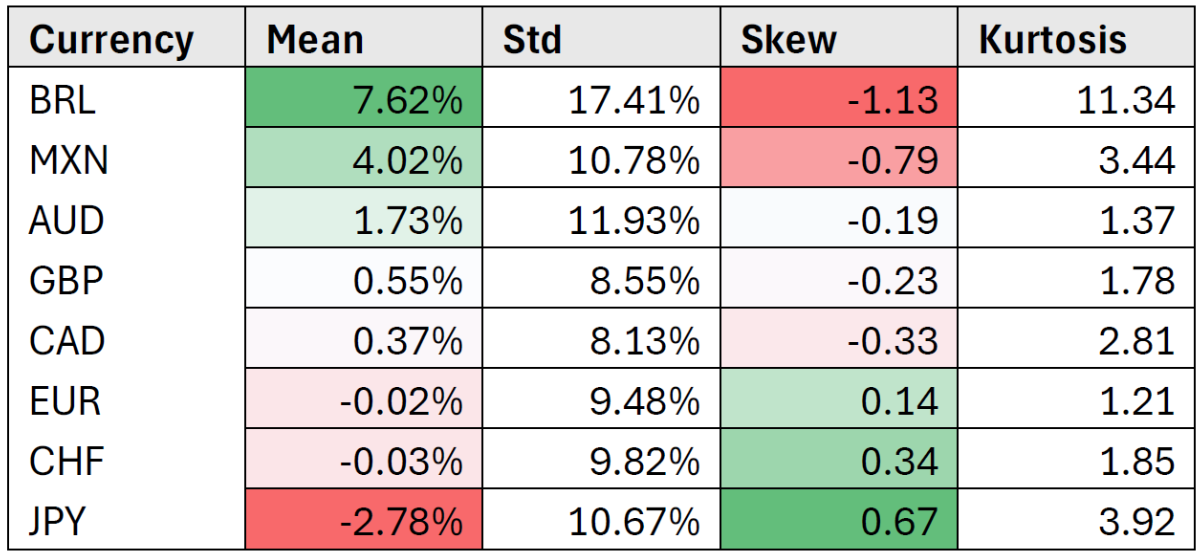
Source: Verdad analysis; Long Spot FX, Short USD. Monthly excess returns sampled from 1996-2025 or earliest available. Mean and Std are annualized. Reported kurtosis is excess kurtosis. Excess kurtosis measures tail thickness—higher values indicate more frequent extreme returns.
This trade-off between tail risk and return becomes much clearer when plotted. In Figure 2a, high-carry currencies cluster in the high-return, negative-skew region, reflecting their tendency to deliver steady gains punctuated by sharp losses. Take the Mexican Peso (MXN), for example: it offers strong average returns but at the cost of pronounced negative skewness, making it vulnerable to sudden drawdowns. Notably, this risk profile doesn’t stand out in Figure 2b. MXN appears relatively unremarkable in return-volatility space. The contrast highlights a key limitation of traditional mean-variance frameworks when applied to FX: they capture how much returns vary, but not how they behave in the tails.
Figure 2a: Excess Return vs Skewness Trade-Off
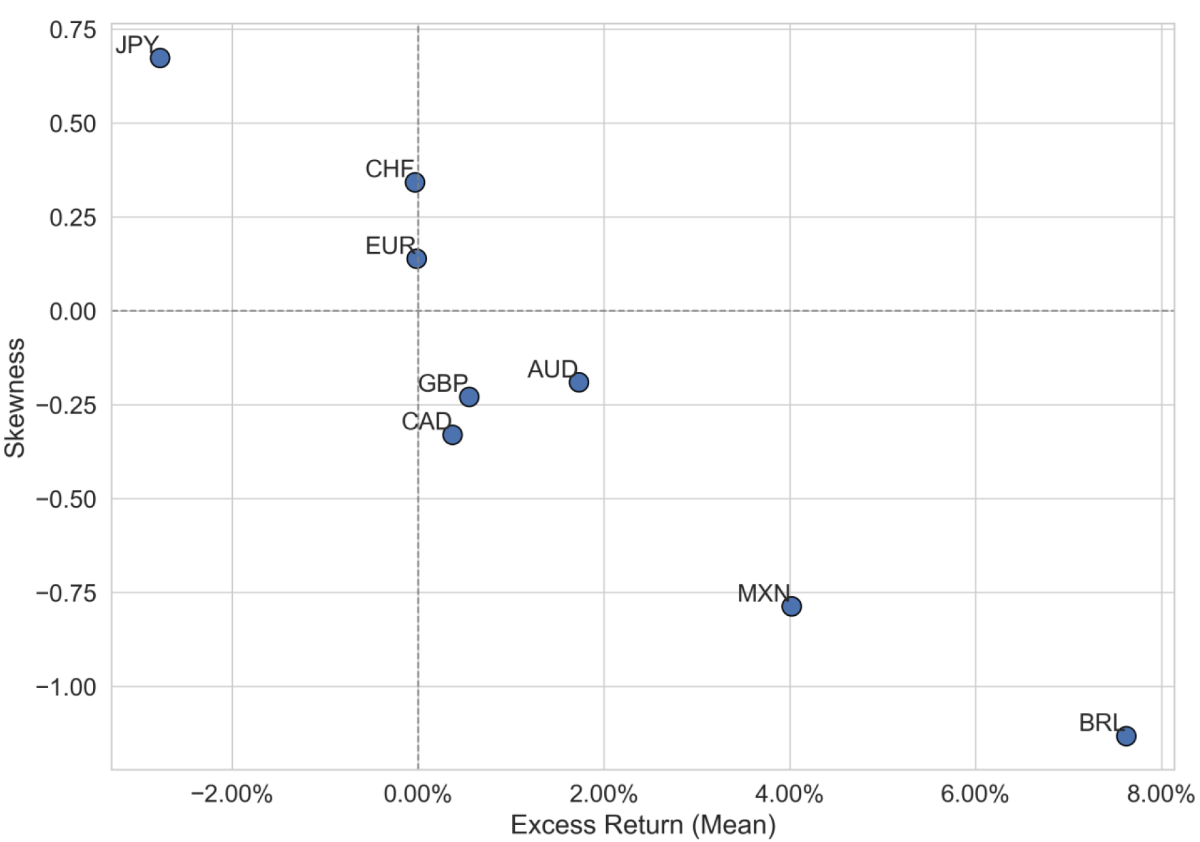
Source: Verdad analysis. Monthly excess returns from 1996-2025 or earliest available. Mean and Std are annualized.
Figure 2b: Excess Return vs. Volatility Trade-Off
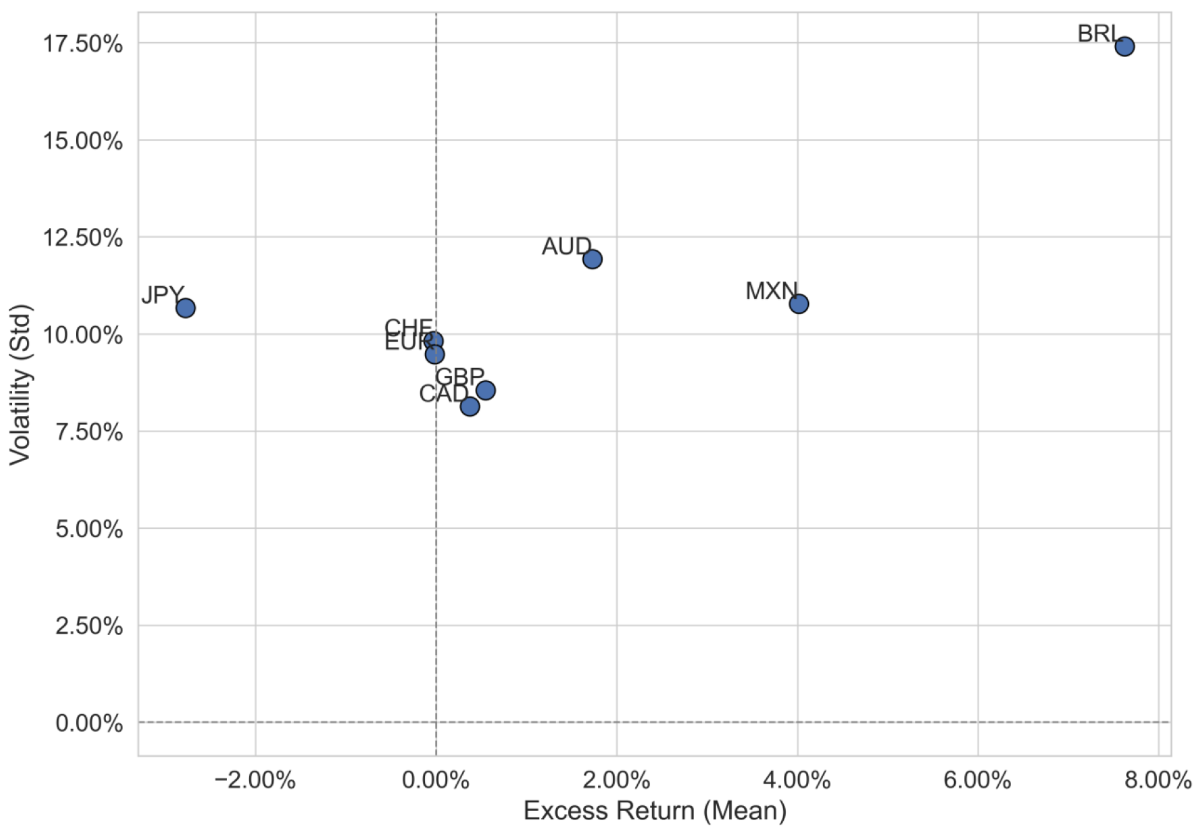
Source: Verdad analysis. Monthly excess returns from 1996-2025 or earliest available. Mean and Std are annualized.
Carry blowups are often sharp and follow predictable patterns:
Speculative positioning stretches.
Macro or policy shocks elevate global volatility.
Funding stress sparks a dash for safety.
Simultaneous trade unwinding magnifies losses.
In these episodes, both legs of the trade hurt: funding currencies (safe havens) surge while investment currencies collapse. Historical episodes illustrate these dynamics vividly: LTCM (1998), the global financial crisis (2008), and the COVID-19 market squeeze (2020) each wiped out several years of carry gains in weeks.
As we’ve noted before, carry also embeds equity beta. That makes it particularly vulnerable in broader risk-off regimes, exactly when investors need a ballast to their long equity woes. Taken at face value, investors face a strategic choice: maximize yield and stomach equity‑like drawdowns or give up some spread for greater resilience. But this kind of risk management is blunt.
To manage risk intelligently, we turn to factor modeling. A simple two-factor model goes a long way:
Carry (CAR) – a dollar-neutral spread between high- and low-yielding currencies.
Dollar (DOL) – an equal-weighted long basket of major non-USD currencies versus the dollar.
In our own analysis of eight liquid currency pairs, these two factors explain roughly one‑third of monthly cross‑sectional variance and more than half of aggregate time‑series variance. A principal component analysis (PCA), which identifies dominant patterns in data, confirms this structure. The first principal component, which captures the most common source of return variation across currencies, aligns almost exactly with DOL (ρ ≈ 0.98). The second component, which captures the next most important pattern, closely maps to CAR (ρ ≈ 0.80). This mapping suggests that most of the structure in FX returns can be explained with just these two intuitive building blocks, making the model highly practical for both return attribution and risk management.
While the two-factor model can help manage FX exposures, it provides limited insight into return enhancement beyond pure carry. Carry trades exploit interest rate differentials but often overlook whether those spreads reflect genuine compensation for risk or temporary mispricing. A valuation lens provides that context.
To improve both robustness and long-run performance, we incorporate a valuation overlay using real effective exchange rates (REER). REER adjusts exchange rates for inflation differences across countries to reflect relative purchasing power, helping identify whether a currency is over or undervalued. A higher REER typically indicates that a currency is overvalued, meaning it’s more expensive than it should be based on what people can actually buy with it.
High-yield currencies that are also cheap on a REER basis are more likely to deliver durable returns. Conversely, expensive high-carry currencies tend to be more vulnerable to sharp corrections, especially during global risk-off episodes. By jointly sorting currencies on carry and valuation, investors can tilt toward opportunities where yield is supported by fundamentals.
A simple simulation, shown in Figure 3, illustrates the improvement. Each month, we formed portfolios from a universe of eight major currencies: AUD, BRL, CAD, CHF, EUR, GBP, MXN, and JPY. The baseline carry portfolio was constructed by ranking currencies on their spot carry (interest rate differential vs. USD) and taking equal-weighted positions: 100% long (approximately 33% each) in the three highest-carry currencies, and 100% short the three lowest. This results in a dollar-neutral portfolio with 200% gross exposure. A pure value portfolio was built using the same construction logic but based on currency valuations, measured by REER.
For the combined carry and value portfolio, we calculated cross-sectional z-scores for both spot carry and REER each month. These were averaged into a composite score, and currencies were ranked accordingly. The top three were held long, the bottom three short—again equally weighted within each leg and dollar-neutral, with total gross exposure of 200%.
Figure 3: Simulated FX Backtests
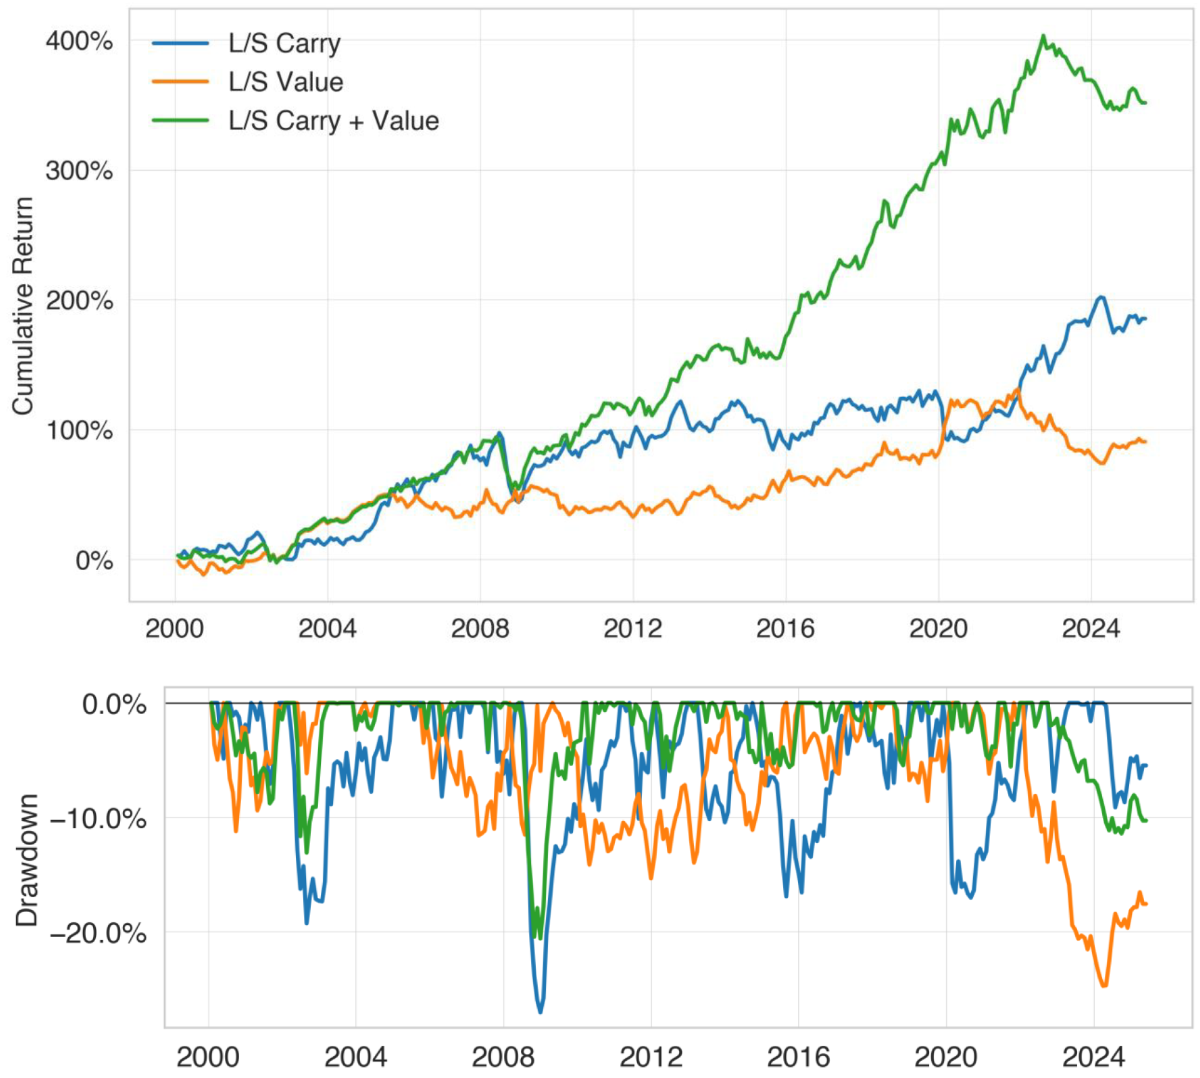
Source: Verdad analysis. Portfolios are rebalanced monthly using equal-weight long-short sorts (n = 3). The carry + value strategy combines cross-sectional z-scores of spot carry (interest rate differentials vs. USD) and real effective exchange rates (REER). Currency universe includes AUD, BRL, CAD, CHF, EUR, GBP, MXN, and JPY.
Figure 4: Performance Table
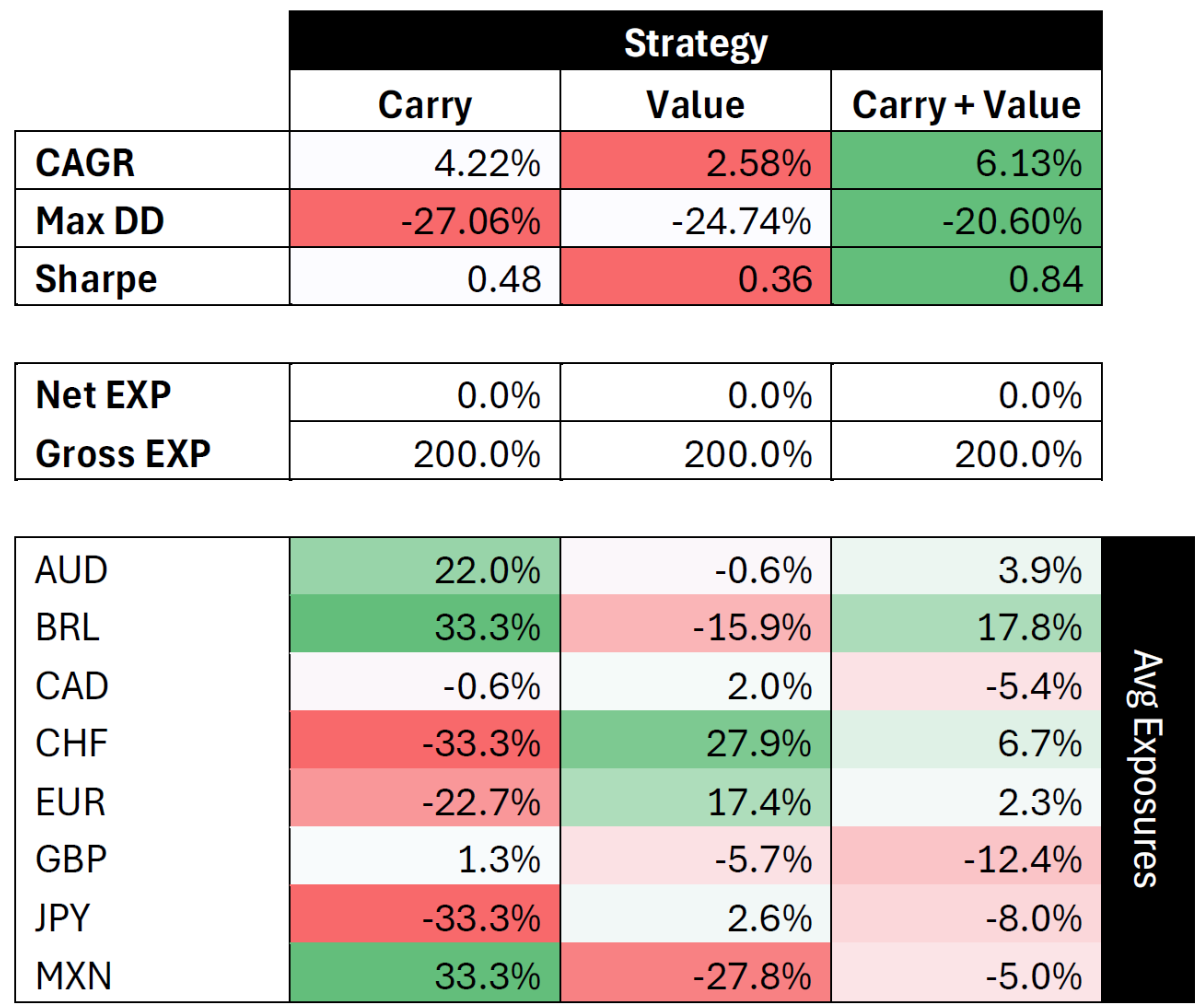
Source: Verdad analysis.
We believe integrating value indicators reduces drawdowns, boosts returns, and significantly improves risk-adjusted performance. While precise currency forecasting remains challenging, REER provides a consistent cross-sectional signal of currency mispricing. A growing body of academic literature also suggests that alternative weighting schemes and taking dynamic dollar exposure can offer additional improvements to the simple dollar-neutral strategies shown here.
The FX carry trade is a little like collecting above-market rents from a property perched on a known fault line. Returns are attractive, but earthquakes are inevitable. The goal is to keep collecting rent without getting wiped out. This means hedging downside risks, sizing positions carefully, and complementing the carry spread with fundamental and macro indicators.