PIPE-Works and PIPE-Dreams (Part I)
A 23-year analysis of private investments in public stock in Japan and the US shows a history of investing at the extremes.
By: Verdad Research & Rina Okachi
The pecking order theory of capital suggests that companies should prefer to finance themselves first through internal cash flow (the cheapest source of cash), second through debt (at moderate interest rates), and only through equity issuance (the most expensive for owners) as a last resort.
In our opinion, most public companies can successfully sell shares into the market when they need to raise this capital. But some companies, whether because of small size or business problems, can only raise capital from private investors in a transaction called a private investment in public equity or PIPE. PIPEs arose in the US in the 1990s as Oaktree Capital was popularizing distressed investing on the credit side. PIPEs had become quite commonplace in America by 2008 when Buffett gave his nod of approval with Berkshire’s multibillion-dollar investment in then-distressed General Electric, noting in his otherwise bleak annual letter that “we very much like these commitments.”
PIPEs are uniquely interesting to us for a few reasons. First, we’ve long had a niche research focus on the intersection of private and public markets. PIPEs are a unique case study where the differences between private and public investor decisions and results over long horizons and large samples are relatively easy to quantify from independent data sources. Second, PIPEs are a mix of microcap deep value and microcap growth—two extremes that we can parse and analyze. Third, PIPEs are now more common in Japan, where we have a specialty, and Japan is unique in having very low interest rates and very low bankruptcy rates, offering an even more interesting petri dish for exploring these odd transactions.
We compiled a dataset of all 29,282 PIPE transactions in the US and Japan between January 2000 and August 2023 using Compustat’s transaction database. Our dataset is bigger than many previous studies primarily because we cover a full 20-year horizon that is more recent and we include over-the-counter (OTC) PIPE deals, which is a significant portion of the US dataset. Some of the previous studies only looked at NYSE- and NASDAQ-listed PIPE deals. To avoid including extremely illiquid penny-stock deals on the fringe, we did exclude any transactions where the market capitalization of the issuer one day before announcement was less than $1M.
This week we will highlight what your typical PIPE deal looked like in both countries, with a focus on some of the more surprising characteristics in each country. In the second half of our study, we’ll focus on the investment returns.
Figure 1 below highlights the summary statistics of the typical PIPE issuer in our dataset.
Figure 1: Summary Statistics of All PIPE Transactions (2000–2023YTD)
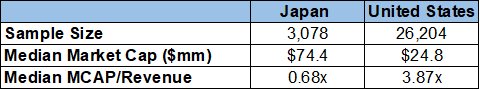
Source: Compustat. The gap between the two sample sizes is significantly inflated, given about half of the US count was OTC transactions (unlike Japan’s main exchange transactions). During the first half of the horizon there were essentially no Japanese PIPEs, and many of the US PIPE transactions were part of multi-round “seed/series” investments in the same company each counted independently here.
In aggregate, the dataset had significantly more PIPE transactions in the US compared to Japan over the last 23 years. However, on a “same-same” basis, we estimate there were only about 50% more PIPEs in the US for publicly listed stocks on main exchanges over the last decade. PIPE transactions were usually microcap transactions that involved very small stocks with market caps below $100M in each country. For valuations, your typical PIPE issuer in Japan traded at 0.68x revenue before the announcement (versus about 0.9x for the TOPIX over the period). In the US, they traded at 3.87x revenue before the announcement (versus about 2x for the S&P 500 over the period).
The premium of US PIPE issuers to US public market valuations may be surprising for an ostensibly distressed investment class. However, this is in large part explained by the extreme overweight in biotech PIPEs in the US. Over 26% of the US PIPEs in our dataset were in health care companies at extraordinarily high multiples. Meanwhile, Japanese PIPEs were similarly overweight in consumer discretionary stocks, a significantly cheaper sector. Even without health care, US PIPEs were much more expensive compared to Japan, and were still more expensive compared to their own market. US PIPE issuers haven’t been cheap. Figure 2 below shows the breakdown of PIPEs by sector for both issuer multiples and deal concentration.
Figure 2: Median Multiple and Deal Count Concentration by Sector
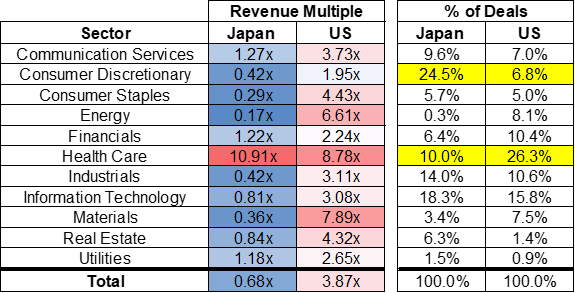
Source: Compustat. All PIPE transactions excluding issuers with a market cap less than 1M USD. US count includes OTC transactions.
Looking over time, while US PIPE transactions were relatively common coming out of the 1990s, they didn’t gain prominence in Japan until the 2008 crisis. Over the last decade, there have been about 200–250 pipe transactions a year in Japan (250 is about 8% of the publicly listed firms in Japan). Additionally, there has been some cyclicality for PIPE transactions around default cycles in each country, as one might expect for distressed investing. The vast majority of PIPE deal flow, however, seemed to occur regardless of the level of distress in each economy. Figure 3 below shows the number of PIPE deals in each country each year.
Figure 3: PIPE Transactions Each Year (2000–2023YTD)

Source: Compustat. All PIPE transactions excluding issuers with a market cap less than 1M USD. US count includes OTC transactions. 2023 is YTD through August.
While Japan was a latecomer, the number of PIPE transactions has increased quite dramatically since the 1990s in both countries.
For the subset of our dataset with common stock PIPE transactions (excluding options, converts, preferred stock, and debt-like instruments), we measured the discount PIPE investors got in the issuer’s stock compared to the stock price one day prior to the announcement. For example, if the company’s stock traded at $100 per share and the PIPE investor paid $50 per share, they got a 50% discount. Figure 4 below shows the distribution of PIPE discounts over time.
Figure 4: PIPE Discount to Public Market Equivalent

Source: Compustat. All PIPE common stock transactions excluding issuers with a market cap less than 1M USD. US count includes OTC transactions. Regulations around PIPE pricing and board approval requirements have evolved in both countries since the earlier years in this dataset.
While the median PIPE discount shown above has narrowed over time, there is still a broad range of discount levels. Over time, there have been significant spikes in discount rates during default cycles following years of macroeconomic distress. For example, in the 2003 default cycle, the default cycle following 2008, and the beginning of the pandemic, median PIPE discounts almost doubled each time. There seems to have been more pronounced cyclicality in the discount rate for PIPEs than in PIPE deal count.
Overall, the descriptive data here suggests that PIPEs over the last 23 years were not always the stereotype of distressed rescue finance in cheap cyclical firms that were down on their luck and couldn’t get a loan. Especially in the US, the form of financing has been used as much for funding biotech ventures that have yet to produce much revenue (let alone profits) as it has been for scooping up cigar-butts at cyclical lows when markets were risk-off. Additionally, most PIPE deal flow was not predicated on a recession (although the discount rates did increase with default cycles).
PIPE deals (at least in the US) have looked about as much like small growth (or venture) on steroids as they did like small value on steroids.
All of this nuance and diversity over time may call into question some aspects of the pecking order theory of capital, especially if extended to Japan. PIPE investors of all sorts certainly may be taking more risk across the board lending to companies who can’t get a bank loan, but it remains to be seen whether markets have compensated them for it equally.
Next week, we’ll explore what all this means for PIPE returns looking backward and forward.
Rina Okachi is an MBA Candidate at Wharton. She was born in Japan, is interested in the intersection of public and private markets, and is looking to pursue a career in finance. If you'd like to connect with Rina, please reach out to okachi@wharton.upenn.edu.