Managing Risk When Credit Spreads Rise
Rising spreads can foreshadow nonlinear downside risk
By: Verdad Research
Warren Buffett says that his rule No. 1 of investing is “Never lose money.” Rule No. 2 is “Never forget rule No. 1.” At Blackstone, Stephen Schwarzman’s first rule is “Don’t lose money.” In Margin of Safety, Seth Klarman writes, “I too believe that avoiding loss should be the primary goal of every investor.”
Avoiding losses is clearly desirable, but how can we reliably assess risk-reward tradeoffs? When does it make sense to take chips off the table and become defensive?
We believe that credit spreads offer the best barometer for measuring investment tradeoffs and that, when high-yield spreads rise above the 10-year median, the risk of losses increases substantially.
High-yield spreads crossed their 10-year median of 430bps on May 9. Last week, spreads reached 494bps before beginning to fall.
Figure 1: High-Yield Spread Relative to 10Y Median since May 2020
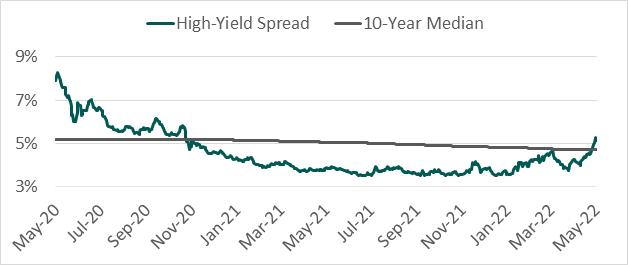
Source: FRED, Verdad
History shows that the likelihood of appreciable losses increases substantially when spreads rise to these levels. Figure 2 shows cumulative max drawdowns to the S&P 500 by high-yield spread level.
Figure 2: HY Spread Level vs. S&P 500 Max Drawdown, 1954–2000

Source: FRED, Bloomberg
Every equity drawdown of -30% or more has occurred within six months of high-yield spreads crossing the 10-year median of 430bps. As Ben Bernanke highlights, credit markets amplify and propagate shocks to the real economy. Within this framework, deteriorating credit market conditions—such as increases in insolvency and rising real debt burdens—feed back into the economy, which in turn worsen credit conditions.
Since 1954, there have been approximately 23 times that high-yield spreads have reached the 430bps level. In 10 of those instances, spreads retreated. In 13 of those instances, spreads continued to rise. Figure 3 shows returns to major asset classes in the two scenarios.
Figure 3: 3M FWD Returns Starting 430bps Threshold by 3M Spread Change, 1954–2020

Source: FRED, Bloomberg, Capital IQ
While the average difference in returns may seem palatable, the distribution is fat-tailed, and losses can be significant. The bottom quintile of returns for the S&P 500 when spreads continue to rise is -12.0% within three months, and the bottom quintile of returns for oil is -25.1%.
Aside from a widening in high-yield spreads, other warning signs have been flashing. A strengthening dollar has been hitting emerging markets, many of which are now facing drawdowns greater than 20%.
Figure 4: Select Emerging Markets with Drawdowns Exceeding 20%

Source: S&P Capital IQ
While the markets of many Central and Eastern European countries have sold off considerably, drawdowns are global.
Both the S&P 500 and EAFE indices are well below their 200-day moving averages, another bearish indicator for the market.
Figure 5: S&P 500 and EAFE vs. 200-Day Moving Averages

Source: S&P Capital IQ
Being defensive can be costly in the short term. Indeed, spreads could reverse course and risk assets could see a recovery. And buying at this point has been the correct decision about 45% of the time. If wrong, however, downside losses could be significant, as every major market drawdown event has occurred following a move in spreads to this level.
With spreads above their 10-year median, the risk of big losses increases nonlinearly, and we find the most attractive risk-reward tradeoff in gold and Treasurys. While bonds had a terrible start to the year, they still outperformed stocks and now seem to have come back into favor as spreads crossed above their median. We could be wrong and miss out on the gains of a reversal, but for the time being we’re content to remember Buffett's rule No. 1 of investing, preserve capital, and be prepared to seize opportunity when the moment arrives.