Lessons from Oregon
The Oregon Public Employee Retirement Fund (OPERF) was one of the first major public funds to invest in private equity in 1981. Since then, OPERF has committed $46 billion to the private equity asset class, generating a net IRR of 15.5% and a 1.7x net multiple of money.
Industry veterans John Hershey and Michael Langdon do an annual review of Oregon’s performance and strategy, and make it publicly available online, much to the benefit of investors like us. Their annual report is one of the best and most informative reads on private equity, because OPERF has the benefit of almost 30 years of experience investing in the asset class.
The focus of the recent two years of reports has been the downshift in returns in private equity. OPERF’s portfolio has trailed its internal benchmark (the Russell 3000 + 300bps) over the past decade.
Figure 1: OPERF Private Equity Returns

Source: OPERF 2019 Annual Report
The issue is not manager selection. In most vintage years, OPERF has been slightly above the Cambridge Associates median of private equity performance. But despite 30 years of experience and the best advisors money can buy, OPERF has been unable to consistently identify top-quartile managers. In fact, only 18% of the funds they’ve invested in have been top quartile.
Figure 2: OPERF Funds by Quartile

Source: OPERF 2018 Annual Report
Rather, the answer seems to lie in changes in the asset class as a whole.
OPERF attributes the downshift in returns to the growing size and competitiveness of the LBO industry. Prior to 2006, LBOs were often bought at significant discounts to the value at which comparable public companies traded. And because the LBO firms were paying such low prices, they could fund these buyouts mostly with debt. But as more money flowed into the market, prices for LBO deals went higher. OPERF found a steep slope of decline for LBO free cash flow yields since the mid-2000s.
Figure 3: Implied Operating Free Cash Flow Yield
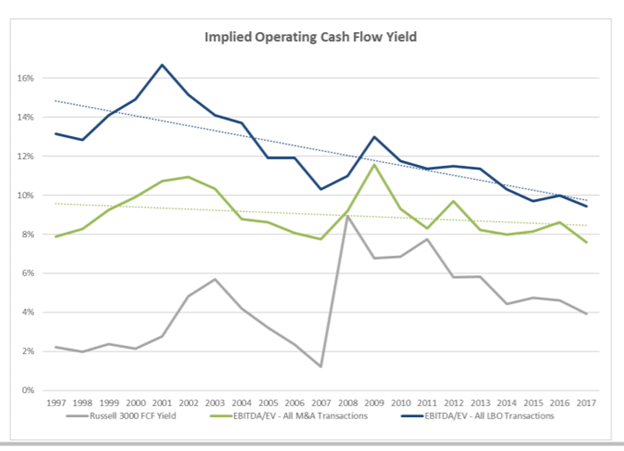
Source: OPERF 2018 Annual Report
The blame for this increase in prices is both the general increase in market valuations and big inflows into private equity as an asset class. “Since 2005—as massive new AUM flowed into the asset class and with the backdrop of both the GFC and subsequent QE, returns relative to public equities become very challenging,” they wrote in their 2018 report.
And these flows created problems for OPERF. Their deployment of capital was highly pro-cyclical, with a much larger amount of money deployed in the most expensive and lowest returning vintage years. Though the performance of their more recent vintage years post-crisis has been strong, that performance has been overshadowed by the continued drag of the pre-crisis vintages.
The below chart shows OPERF’s capital deployment relative to the alpha generated by the private equity asset class as a whole.
Figure 4: OPERF Capital Deployed vs. Asset Class Returns to Private Equity

Source: OPERF 2019 Annual Report
Relatively little capital was deployed in the most attractive vintages relative to the least attractive. The chart ominously shows a sharp rise in capital deployment and the start of a decline in asset class alpha since 2014.
The actual experience of a large investor in PE tells a different story—a more honest and insightful story—than Wall Street’s slick marketing pitches. Top-quartile returns are hard to achieve: most investors get returns that look like the median, even with top-tier advisors calling the shots. Meanwhile, OPERF’s 2018 report acknowledged that, “In most vintages, top-quartile outcomes were required to capture a meaningful return premium.” Private equity returns have been disappointing over the past decade. The low returns have been the result of deploying too much capital in the most expensive, and thus underperforming, vintages. And massive capital inflows have driven purchase prices to the lowest levels in history.
Links:
OPERF 2018 Annual Report
OPERF 2019 Annual Report