Japan's Rally Meets Shareholder Activism
What activists buy in Japan
By: Naoki Ito
Japan is undergoing a market regime change. The Tokyo Stock Exchange (TSE) has put unprecedented effort into corporate governance reform, companies are improving capital efficiency by returning unproductive assets to shareholders, and major indices like Nikkei 225 keep setting record highs.
Another sign of the regime change is the surge in shareholder activism. The TSE has endorsed engagement, even publishing “Cases Where Companies Are Not Aligned With Investors’ Perspectives” to amplify investors feedback inside boardrooms. As Figure 1 shows, the number of companies receiving shareholder proposals in June annual general meetings (AGMs) has more than tripled over the past decade.
Figure 1: Number of Japanese Companies Receiving Shareholder Proposals at June AGMs (2015–2025)
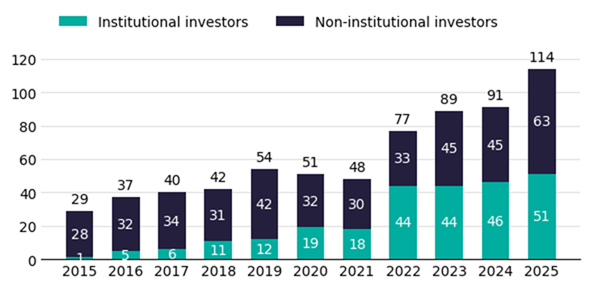
Source: Sumitomo Mitsui Trust Bank
Activist investors have moved from near obscurity to regular front-page coverage. Which brings us to the question: what are these funds buying in Japan?
To analyze the quantitative pattern in targets, we built a fund-by-fund profile using Large Shareholding Reports that investors file once they cross five percent ownership. For each campaign, we measured the target company’s fundamentals in the month before the filing to capture what the activist actually bought, not what the public sees after filings come out. Figure 2 reports medians by fund in size, value, quality, and balance sheet inefficiency factors.
Figure 2: Median Historical Target Profile of Activist Funds in Japan (2013–2025)
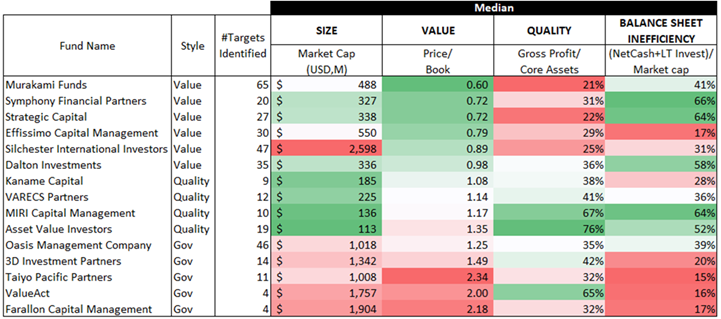
Sources: EDINET, IR BANK, S&P Capital IQ, Verdad analysis. Notes: Gross Profit/Core Assets is gross profit divided by total assets excluding cash equivalents and long-term investments. “LT Invest” is long-term investments on balance sheet. “Murakami Funds” includes City Index Eleventh, Aya Nomura, Reno, and Minami Aoyama Fudosan. “Dalton Investments” includes Dalton Investments, Nippon Active Value Fund, and NAVF Select. Style classifications reflect our subjective assessment.
We see activist strategies clustering into three broad focus areas: value, quality, and governance.
Funds focused on value, like Murakami and Symphony, tend to buy small companies that trade at P/B below 1x, with roughly half the market cap sitting in net cash and securities. Their campaigns typically push to redeploy or distribute idle cash and unwind long-term investments, such as cross-shareholdings.
Those focused on quality, such as MIRI and Asset Value Investors, tend to target companies with stronger GP/A, at the expense of somewhat higher P/B. Their targets also often have inefficient balance sheets with unproductive assets.
Funds known for governance-led campaigns at large caps—like Oasis and 3D—seem to place less weight on valuation and focus on who runs the company and how it is run, prioritizing operational strategy and board effectiveness.
Having seen a variety of strategic styles in target selections, the next question is simple: which target company profiles, defined by the quantitative factor exposures, deliver the strongest performance across the funds?
We aggregated the funds’ activism targets and measured the one-year forward return for each target since activists’ entry points. We also ranked the quantitative metrics at each point in history across all Japanese companies and assigned each target to be either below or above median at the time of activists’ entry. By cross-sorting on the four quantitative factors, we took the average return in each group of observations. The result is in Figure 3.
Figure 3: Avg 12M FWD Returns by Quantitative Characteristics within Activists’ Targets in Japan (2013–2025)
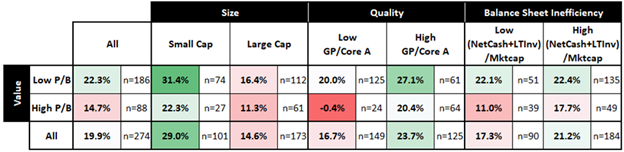
Sources: EDINET, IR BANK, S&P Capital IQ, Verdad analysis. Note: Observations with market cap above $50M are included in the median-based cutoff calculations.
Across the activist funds’ targets in Japan, the higher one-year returns tend to come from ones that, at entry, are cheap, small, high quality, and rich in unproductive assets. When we group these factor exposure observations from Figure 3, the average one-year forward return outweighs the group of fully opposite observations by 36%, as seen in Figure 4.
Figure 4: Avg 12M FWD Returns by Activist Target Profile at Entry (2013–2025)
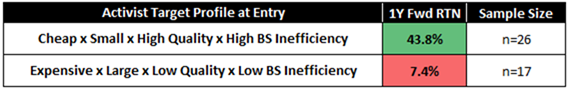
Sources: EDINET, IR BANK, S&P Capital IQ, Verdad analysis
We think the nationwide trend in Japan helps explain this difference. The TSE’s push for capital efficiency makes activism agendas targeting low P/B and inefficient balance sheets easier to advance and harder for boards to dismiss than appeals to operational excellence.
Although activism may have advantages in directly catalyzing value, the trade-off is that the strategy carries significant risk of illiquidity. Funds tend to seek large stakes to influence outcomes, which makes exits slower and more expensive unless a take-private or a negotiated block trade materializes.
Based on the latest disclosures, the median ownership stake in target companies across profiled funds is 10% of total shares outstanding. Compared to the median last-twelve-month average daily volume, the median stake size is 37.2x the daily volume traded. It would take almost a year and a half of selling around 10% of daily volume every day in market to exit such a stake with minimal market impact.
For investors who avoid concentrated stakes and the legwork of proxy battles with unclear chances of success, there is a practical path: let TSE pressure and market incentives do most of the work.
The TSE request for improved capital efficiency reduces the need for confrontational tactics. A diversified portfolio that tilts toward sub-1x P/B small companies with decent operational quality and bloated balance sheets allows investors to harvest much of the same payoff as activists while avoiding the legal, reputational, and liquidity risks.
Today, 38% of the market trades below book, and 21% of companies in Japan hold more than half of market cap in net cash and long-term investments. Despite the recent rally, the value-trap reversal appears to have further to run. A prudent investor may well be able to capture the balance sheet re-rating while keeping portfolio concentration and exit risk in check.