Is CEO Performance Persistent?
Gregg Lowe is a star CEO when measured by his consistency at generating shareholder value. He took over at Freescale Semiconductor in June of 2012. Three years later, he managed the sale of Freescale to NXP for nearly 4x the share price when he took over. In September of 2017, he took over as CEO of CREE. The stock is up almost 60% since he became CEO, versus a flat S&P 500 over the same period.
But for every Gregg Lowe, there is an example on the other side. Brian Woolf led Cache Inc from 2000 to 2008, earning investors a 5.8x return on their investment over those eight years. He was hired five years later to be CEO of Body Central. The press release announcing his hiring cited his excellent leadership at Cache. But by January 2015, Body Central had closed every single one of its stores and investors lost almost all their capital.
These two opposing examples highlight key questions about corporate management: is CEO performance persistent? Are some people simply better managers, able to consistently generate high returns for investors in the companies they run? And can we identify these people based on an examination of their track records?
Haonan Li and I set out to answer these questions empirically. We looked first at performance persistence within companies: whether a CEO’s early track record predicts their later performance. We then looked at CEOs who ran multiple companies to see if their performance at the first company predicted outcomes at the second.
Persistence within Companies
How well does the first three years of a CEO’s returns predict the second three years of returns?
To answer this question, Haonan filtered his database for CEOs who have tenures longer than six years at one company. He then separated each CEO’s return record into two buckets: Years 1–3 and Years 4–6. To eliminate the confounding effect of different market conditions, Haonan adjusted returns by the performance of the S&P 500 index. Within each of the two time-horizon buckets, he sorted the CEOs’ market-adjusted returns into quartiles. Haonan then identified the CEOs who were above the median twice and those who were in the top quartile twice.
To interpret the results, it’s important to consider what we would expect to see by random chance. Similar to a coin-flip, 50% of CEOs should be above-average performers, and 50% of CEOs should be below-average over each three-year time horizon. And just as a coin has a 25% chance of landing on heads twice in a row (50% x 50%), we should expect 25% of CEOs to be above-average in both Years 1–3 and Years 4–6, purely by chance. But, if we are to believe that CEO performance is always persistent, we would expect to see 50% of CEOs perform above average in the two successive three-year periods (50% x 100%).
A similar calculation would apply to the top quartile CEOs. If every CEO randomly has a 25% chance of being in the top quartile over a three-year period, then we should expect about 6% of CEOs to be in the top quartile in two successive three-year periods (25% x 25%) due to luck alone. If, however, there is full performance persistence, then 25% of CEOs would be in the top quartile in Years 1–3 and Years 4–6.
The actual CEO performance results line up very closely with what we could expect to see by chance. 25% of the 2,420 CEOs in our database had above-average performance in two successive three-year periods, and 7% of CEOs had top-quartile performance in two successive three-year periods.
Figure 1: Persistence of CEO Performance as Measured by Share Price Return
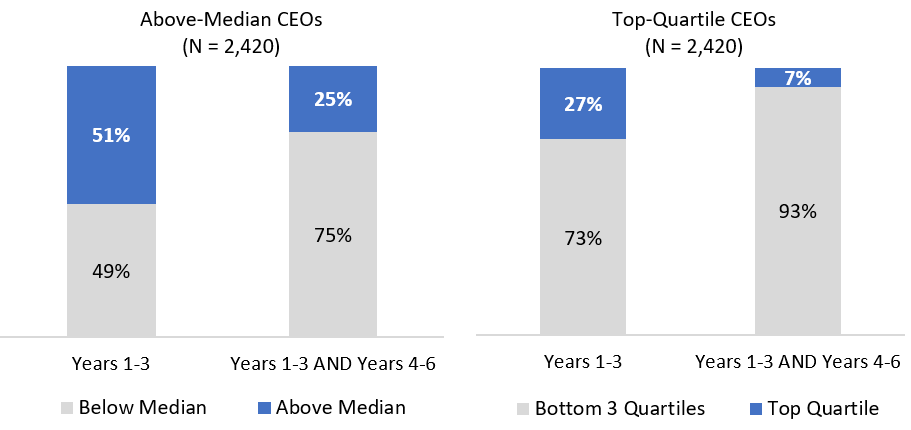
Source: Verdad research
As the figure above demonstrates, there is almost no persistence in CEO performance. The observed number of CEOs in each category is indistinguishable from what we would expect if the process were entirely random.
Visualizations of the underlying return data tell the same story. Figure 2 below compares Year 1–3 returns to Year 4–6 returns. If the performance between these two periods of time were perfectly correlated, the data would form a diagonal 45-degree line.
Figure 2: Shareholder Returns for CEO Years 1-3 vs. 4-6

Source: Verdad research
This chart reveals no discernable relationship for CEOs in general. Historical performance does not appear to predict future performance, at least as measured by share price returns.
This is not an intuitive finding—and academic studies suggest that this is not how boards think, particularly when it comes to firing bad performers. A recent study found that CEOs are often fired after bad firm performance caused by factors beyond their control, a finding in conflict with the standard economic theory of rational expectations. Boards are far more likely to fire CEOs when the industry is having trouble broadly, attributing to a person what was in fact an exogenous economic shock.
Persistence across Different Companies
What, then, can we expect of CEO performance persistence across different companies? Headhunters and corporate boards often look for CEOs with a track record of creating value at another company when choosing whom to hire. But if past performance doesn’t predict future results, then they might be looking at an irrelevant variable.
To investigate this hypothesis, Haonan filtered his database for CEOs who have headed multiple companies. He then tagged each CEO-company pair with whether it was the first, second, third, or fourth company the CEO has headed. Because there are very few CEOs who have headed more than two companies, he separated the data into two buckets: Company 1 and Company 2 (ignoring observations beyond the first two companies). To eliminate the confounding effect of different market conditions, Haonan adjusted returns by the performance of the S&P 500 index. Within the two company buckets, he sorted the CEOs’ market-adjusted returns into quartiles. Haonan then identified the CEOs who were above the median twice and those who were in the top quartile twice.
As before, if outcomes were completely random, we would expect 25% of CEOs to be above-average performers across two companies (50% x 50%). Similarly, we would expect 6% of CEOs to be top-quartile performers across two companies (25% x 25%) by sheer luck. The actual CEO performance results are below.
Figure 3: Share Price Performance for CEOs Who Ran Multiple Companies

Source: Verdad research
Once again, there is little to no persistence in CEO performance from one company to the next. The proportion of CEOs that continue to perform well is in line with what we would expect under random conditions.
Conclusion
The media is filled with depictions of visionary CEOs who have a record of generating extraordinary returns. An inordinate amount of journalistic effort is directed at dissecting their lives. What was his childhood like? What is his morning routine? What are his management principles? Does he use PowerPoint or not? The huddled masses clamor for these details in hopes of grabbing a piece of the star’s genius for themselves.
But beneath the mountain of CEO profiles are base rates that are virtually indistinguishable from randomness. The focus on the “great man” theory of corporate management may lead to persistent errors. For investors favoring stocks with strong past-performing CEOs, the base-rates suggest this is like betting on heads because the last two coin flips came up that way. If they pay up for this “quality,” it’s worse than that.
An article in the Harvard Business Review, “The Art and Science of Finding the Right CEO,” lists “proven track record” as a top, “obvious” criterion for selecting CEOs. But, to quote Sherlock Holmes, “There is nothing more deceptive than an obvious fact.” Perhaps journalists, investors, and boards are placing excessive emphasis on CEO pedigrees and track records.