Investing for Growth
While high capex spending may boost growth, it does not appear to improve returns.
By: Brian Chingono
In recent weeks, we have witnessed heightened volatility among Big Tech stocks, even though these companies continue to report robust earnings growth. The central reason for this volatility is that investors are evaluating how the surge in capital expenditure for AI capacity will affect Big Tech valuations as these firms transition from capital-light to capital-intensive business models.
We have long advocated the position that investors should prioritize firms with high free cash flow yields. In our view, cash-generative firms have more capacity to pay down debt, repurchase shares, and distribute dividends, which should result in higher expected returns.
One natural question that may arise from this choice to prioritize free cash flow is whether companies with high free cash flow invest enough in their assets to sustain future earnings growth. After all, capex spending is intended to build capacity for future profit generation, but higher free cash flow today usually means lower capex spending. In short, are firms with high free cash flow yields sitting on a shrinking base of underinvested assets?
To evaluate these questions, we used S&P Capital IQ’s database of US stocks over the 28 years from June 1997 to June 2025. Within each year, we sorted all stocks into quartiles according to their LTM free cash flow yield. We also formed a separate set of annual quartiles according to the proportion of operating cashflow that is allocated to capex over the LTM period (i.e., Capex / Operating Cash Flow).
To start, we looked at how these variables predict future earnings growth. As expected, firms with the highest capex spending today tend to generate robust EBIT growth over the next three years (5.2% annualized). And in line with the question about cash flow sustainability, firms with the highest free cash flow yield today tend to generate modest EBIT growth over the next three years (1.6% annualized).
Figure 1: Median 3-Year Annualized EBIT Growth (June 1997 – June 2025)
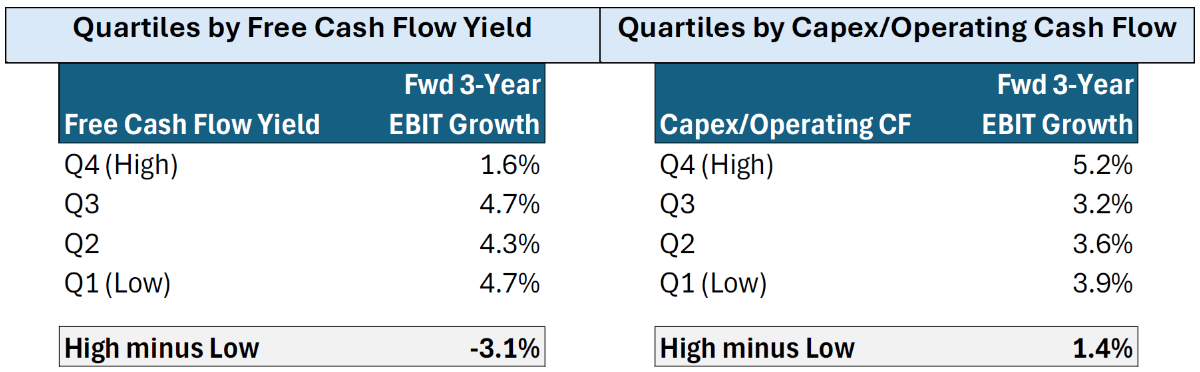
Sources: S&P Capital IQ and Verdad analysis
Yet the crucial question for investors is how these variables predict returns. So in the next step, we looked at how free cash flow and capex spending predict forward returns over one-, two-, three-, and four-year horizons. As shown in the chart below, free cash flow is a strong predictor of returns over these horizons, even without rebalancing over a four-year horizon. On the other hand, capex spending is a much weaker predictor of returns, despite its effectiveness in forecasting higher earnings growth among the highest capex spenders. We find no evidence that higher capex spending increases forward returns. On the contrary, we see mild evidence of lower returns among firms with the highest capex spending. We believe this is a key reason behind the recent volatility of Big Tech stocks as they continue to ramp up capex spending, with aggregate capex by Microsoft, Amazon, Alphabet, and Meta set to more than quadruple in 2025 from 2018 levels.
Figure 2: Forward Returns by Free Cash Flow and Capex Spending Quartile
(1997 – 2025)
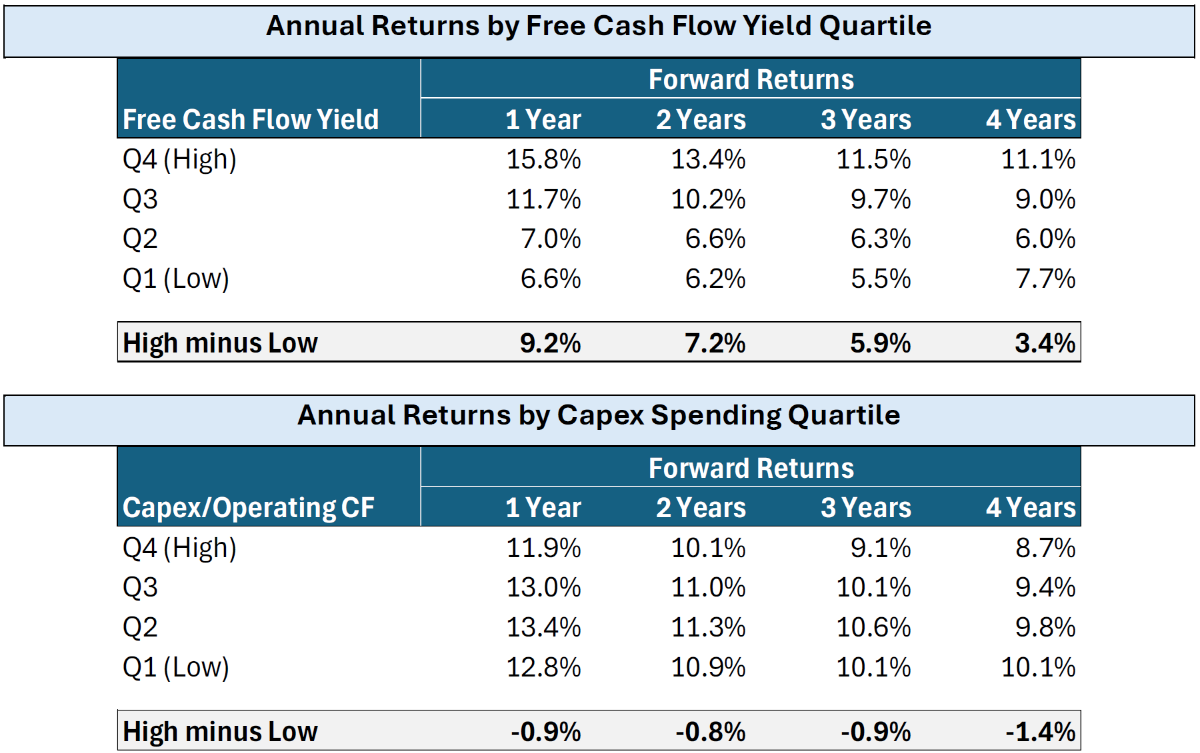
Sources: S&P Capital IQ and Verdad analysis. Returns over horizons longer than one year are annualized.
How do we reconcile the paradox around capex spending? While investing heavily in firms’ assets tends to increase future earnings growth, this benefit does not seem to show up in forward returns.
We believe the answer can be found in measures of Return on Assets (ROA). Our favorite measure of ROA is Gross Profit/Assets because it is a stable and persistent measure of profitability over multi-year horizons. As shown below, firms with higher levels of capex spending tend to have lower ROA. Consistent with this finding, firms with higher free cash flow tend to have higher ROA. In addition to Gross Profit/Assets, we also measure ROA as EBIT/Assets in the tables below, and our findings are consistent across both measures.
Figure 3: ROA by Free Cash Flow and Capex Spending Quartile (1997 – 2025)
Sources: S&P Capital IQ and Verdad analysis
The relationship between capex spending and ROA may have a sectoral explanation, as it’s possible that lower-margin, capital-intensive industries like steel and utilities may require heavier capex spending to maintain and grow their asset base. And we believe this is the key to understanding the recent uncertainty around Big Tech valuations. As Big Tech firms spend their way into transitioning from high-margin, capital-light software business models to capital-intensive business models with uncertain margins, it seems plausible that the ROA of their new investments in data centers could be lower than the ROA of their existing software businesses.
Since sorting companies by free cash flow yield is positively associated with ROA, the free cash flow signal aligns with investors’ goal of capturing the return premium of higher quality firms with productive assets. As shown in the tables below, ROA is a robust predictor of returns over one-, two-, three-, and four-year horizons.
Figure 4: Forward Returns by ROA Quartile (1997 – 2025)
Sources: S&P Capital IQ and Verdad analysis. Returns over horizons longer than one year are annualized.
While high free cash flow yield is not necessarily associated with higher future earnings growth, it is associated with more productive assets as measured by ROA. And since ROA metrics like Gross Profit/Assets are persistent over time, the sustainability of future cash flows among firms with high FCF yields is more closely tied to stable ROA, rather than superior earnings growth in the future. By choosing to pursue earnings growth through aggressive spending on data centers with uncertain ROAs, Big Tech firms seem to be taking a gamble on their valuations, and we believe investors have just begun to take notice.
Appendix A: Characteristics of the FCF Yield Quartiles and Capex Spending Quartiles