Industry Volatility
Are some industries more stable than others?
By: Dan Rasmussen
Revenue and profit growth may be unpredictable, but the volatility of revenue and profit growth is more predictable—and varies significantly by industry.
Looking over the last 30 years, income statement volatility has tended to be persistent and predictable. Regressing trailing volatility of revenue, gross profit and EBITDA on future volatility across industries yields statistically significant results. The below chart shows a few highlights from the full industry ranking.
Figure 1: Industries Ranked by Income Statement Volatility, 1996–2023
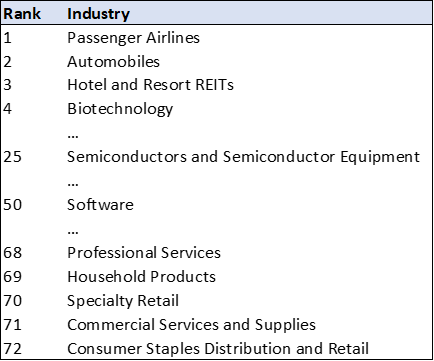
Source: Capital IQ
Unsurprisingly, airlines, automobiles, hotels, and biotech companies tend to be highly volatile. Meanwhile, consumer staples and household products and business services tend to be very stable.
Semiconductors are in the second quartile of volatility while software companies are in the third quartile. Neither industry stands out as particularly volatile or particularly stable. This might come as a surprise to those who believe that software companies, due to their recurring revenue models, are highly stable and thus can handle significantly higher leverage than other types of companies (looking at you, private markets).
In most industries, volatility has remained stable over time, but a few industries have seen changes in the volatility of their income statements. Innovation and disruption seem to be the big drivers of volatility. Our research found that biotech companies and telecom equipment companies became less volatile since the early 2000s as both industries matured. The auto industry, however, grew significantly more volatile due to the rise of electric vehicles.
One might suspect there to be a close relationship between volatility and valuations. One hypothesis would be that more volatile industries are also more dynamic and thus full of high-growth companies that would command higher valuations. Another hypothesis would be that more stable businesses should deserve significantly lower discount rates and thus trade at premium valuations.
But we found that neither of these hypotheses seemed to hold water. Regressions run on TEV/sales on the previous 12 months’ volatility for revenue, gross profit, and EBITDA produced no statistically significant results. Below, we plot each industry with percentile of revenue volatility on the x-axis and current TEV/sales percentile on the y-axis.
Figure 2: Revenue Volatility vs. TEV/Sales

Source: Capital IQ
There are volatile industries with high valuations, stable industries with low valuations, and everything in between. The table below shows industries that place in the top or bottom quartile on either volatility or valuation.
Figure 3: Current TEV/Sales and Volatility

Source: Capital IQ
Income statement volatility varies significantly by industry and is persistent over time. But volatility and stability do not translate into valuations in a predictable way.
Acknowledgment: Verdad intern Lyle Spitz performed the data analysis for this essay. Lyle is a rising senior at William & Mary studying economics, finance, and business analytics. After college, he’s interested in going into investing, and he has a particular interest in quantitative approaches.