From Theory to Practice: Capital Allocation in Japan
Meeting the TSE’s “Cost of Capital Awareness” Mandate
By: Naoki Ito
Cost of capital has become a key concern in Japanese boardrooms, and capital allocation remains a source of tension between investors and CEOs.
This essay explains the investor perspective on capital expenditures and capital allocation, a perspective too often misunderstood by Japanese management teams.
The short answer: investors prefer the certainty of dividends today to the uncertain returns on investment of capital expenditures in the future. As a result, the equity markets reward firms that raise dividends and tend to punish firms that spend heavily on capital expenditures, particularly if those capital expenditures come from a business with slow growth or low return on assets.
This is especially important for companies trading at a price-to-book (P/B) ratio below one. Investors expect each yen earned to be either reinvested profitably or, if sufficient returns aren’t available, returned to shareholders. A P/B below one signals that investors doubt management’s ability to generate adequate returns, fearing perpetual cash hoarding or low-return investments. Investors do not want bloated, inefficient balance sheets laden with cash and underperforming assets. For firms facing such low valuations, we believe the top priority must be restoring market confidence by improving balance sheet efficiency.
To link asset productivity to valuation, we analyzed every company‐year observation across Japanese industries since 2001. We ranked firms into quartiles by gross profit to asset (GP/A) ratio and compared the median P/B of the top and bottom groups for each sector, defined by GICS. GP/A is a stable proxy for asset productivity, avoiding distortions from depreciation or non‐operating income.
As Figure 1 shows, in every sector except energy and utilities, firms in the lowest GP/A quartile trade at markedly lower P/B multiples than those in the highest quartile. This pattern demonstrates that valuations partly reflect how efficiently companies use assets on their balance sheets to generate core earnings.
Figure 1: Median P/B by GP/A and Industry Sector in Japan (2001-2024)
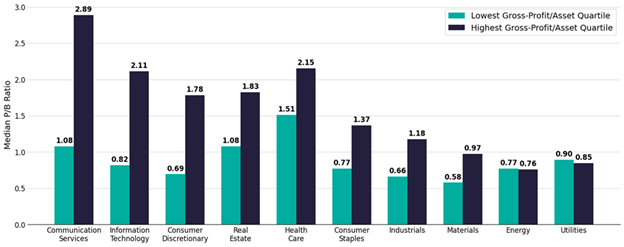
Source: S&P Capital IQ, Verdad analysis. Excludes Financials sector and REITs.
Non‐operating holdings—excess cash, cross‐shareholdings or idle real estate—reduce GP/A. Inefficiencies also appear in core assets when facilities sit idle, inventory accumulates, or R&D yield unproductive assets. In prior research, we showed that firms trimming bloated balance sheets and boosting shareholder returns outperformed the market over the past two years and sharply improved their P/B.
A more fundamental question, though, is how firms should evaluate capital-deployment decisions beyond correcting balance-sheet inefficiencies. In other words, how should companies think about spending the proceeds from unwound assets and incremental operating cash flow?
In theory, every yen of corporate capital ought to be allocated to the project whose expected return most exceeds its cost, with that cost—usually measured by a weighted average cost of capital (WACC)—serving as the ultimate hurdle rate.
In practice, however, calculating a reliable WACC proves elusive. Estimating the cost of equity hinges on beta, which is highly sensitive to the choice of historical window, data frequency and model specification. As market conditions change, beta estimates often shift too.
Projecting future cash flows for an IRR analysis is no less fraught: assumptions about growth rates, margins and investment timing quickly multiply, yielding forecasts so broad they can undermine decision making.
When the Tokyo Stock Exchange issued its March 2023 directive urging listed companies to “be aware” of their cost of capital, it deliberately avoided a one-size-fits-all approach. Rather than getting bogged down in textbook WACC and IRR calculations, the real challenge is to ensure that each deployment of cash at least covers its cost.
In this respect, public equity markets provide the objective verdict: a sustained rise in share price is the clearest proof that management has cleared its cost-of-capital hurdle. A company’s share price distills all available information, calibrating growth expectations against investors’ implicit cost of capital. Deployments that destroy value drag returns down; those that create value lift them.
Even if management cherry-picks data to claim their returns exceed the cost of capital, a flat stock price proves they are not truly fulfilling the TSE’s mandate. How should they identify future actions that create shareholder value? We believe tracing how firms’ past allocation decisions translated into their stock prices provides a clear roadmap.
We grouped firms by industry and year, then split each group at its median on two metrics: GP/A and free cash flow (FCF) yield. FCF yield is the trailing 12-month operating cash flow minus capital expenditures, divided by market cap. It shows how much cash remains for discretionary uses as a percentage of market cap. Heavy capex spending lowers the value. We then tracked the average forward 12-month stock returns for each combination of efficiency and yield. Figure 2 summarizes our findings.
Figure 2: Avg 12M Fwd Returns by GP/A and FCF Yield in Japan (2001-2024)
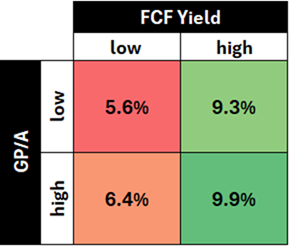
Source: S&P Capital IQ, Verdad analysis. Medians are calculated for each industry-year pair. Excludes Financials sector and REITs.
As Figure 1 implies, improving GP/A is indispensable for boosting corporate valuations. However, Figure 2 demonstrates that high asset efficiency alone does not guarantee future share-price gains. Instead, whether firms have high or low GP/A, those with high FCF yield generate returns that largely exceed those of their low-yield counterparts.
We can break FCF yield into two drivers to understand the implication of this result. The first is intuitive. Firms must increase cash flow from their core operations relative to market cap. The second may not be obvious. Firms should channel a smaller portion of operating cash flow into capex and instead divert more to other uses: debt repayment, higher-productivity acquisitions, share buybacks or dividends.
In particular, firms that dedicate more free cash flow to shareholder returns tend to enjoy greater share-price gains. To show this point more clearly, we looked at shareholder yield, defined as trailing 12-month common dividends paid plus common share repurchases (net of issuance) divided by market cap. As before, we grouped firms by industry and year, then split each group at its median on shareholder yield. Figure 3 supports our claim.
Figure 3: Avg 12M Fwd Returns by Shareholder Yield and FCF Yield in Japan (2001-2024)
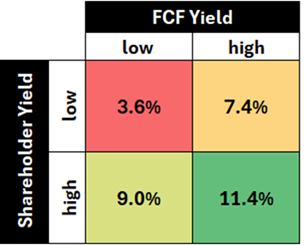
Source: S&P Capital IQ, Verdad analysis. Medians are calculated for each industry-year pair. Excludes Financials sector and REITs.
The result is clear: cohorts with high FCF yield and high shareholder yield deliver returns that dwarf those of cohorts with low FCF yield and low shareholder yield. Returning to our earlier point that share-price increases are the ultimate testament to above-cost-of-capital decisions, management must recognize that plans focused on income statements alone won’t clear the cost-of-capital hurdle.
For context, the thresholds dividing low and high metrics—calculated as the mean of industry sector medians—are 24.8% for GP/A, 4.2% for FCF yield, and 1.5% for shareholder yield. For detailed, sector-specific medians, see Appendix 1.
Merely setting targets for sales or operating-income growth and indiscriminately dumping cash into capex does not create value. Management must limit spending to what the business truly needs and run operations efficiently on minimal capex—not because all spending is bad, but because every yen must be used wisely to earn each additional yen. This can prevent the asset base from becoming bloated with low-returning assets. A growth plan that meets the cost-of-capital requirement must pair goals for higher asset efficiency with direct shareholder returns.
Idle cash must also be avoided. It inflates the asset base without generating profit. While temporarily holding reserves for future value-creative projects makes sense, boards must not let cash sit as perpetual “dry powder.” We believe management should deploy capital to opportunities with the highest expected returns. Hoarding cash is as senseless as an asset manager keeping client funds in a money-market account instead of investing them. Shareholders have a low tolerance for such passivity when they can deploy capital elsewhere. At minimum, management should explain to shareholders how it plans to deploy reserved cash, for example, by outlining its criteria for target M&A selections.
Ultimately, capital allocation is about opportunity cost. Instead of asking, “Is our return on equity above our cost of equity?” managers can compare the expected returns of each option. If ¥1 billion of capex promises a 5% IRR but buying back shares at today’s depressed valuations delivers 10%, the choice is clear. Even without exact forecasts, comparing options is straightforward.
Boards should adopt simple, intuitive decision rules grounded in market feedback rather than overengineered financial models. By treating the market as the ultimate arbiter of value-creating choices, Japanese companies can escape the paralysis of imprecise calculations and ensure every yen of capital advances shareholder interests.
Appendix 1: Metrics Medians by Industry Sector in Japan (2001-2024)
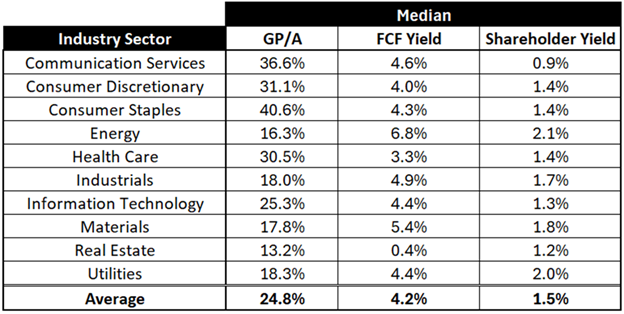
Source: S&P Capital IQ, Verdad analysis. Medians based on pooled firm-year observations within each sector, not on annual medians.