Betting Against Expensive Junk
Why the value and quality factors worked in 2022
By: Greg Obenshain with Clark Dean
For the first six months of this year, long-only investors really couldn’t win. Unless you started the year long oil, almost every major asset class produced losses.
Figure 1: Asset Class Returns H1 2022

Source: Bloomberg. Gold, Copper and Oil returns use front month futures. High Yield is the HYG ETF, and Treasurys are the IEF ETF (7- to 10-year Treasurys).
To win, you needed to be short something. Anything, really. But there were some people who shorted exactly the right things and did very well. According to Bloomberg, AQR’s absolute return strategy was up more than 43% before fees through May, a redemptive event after several years of suffering underperformance at the hands of value (we sympathize). While AQR is most associated with value investing, the performance was not just value. In an entertaining recent post, “We Are Not Just Value! Except, You Know, When We Are…”, Cliff Asness, the head of AQR, explained that the fund was only tilted so strongly toward value in the recent period because value and the other factors have been correlated, or “said another way, it seems the bubble fans don’t just like expensive names—they like expensive, high-beta, low-quality names.”
When a fund that uses market-neutral factor exposures does this well, it’s worth digging into. To do this, we can use the Ken French data library for data on the value factor and use AQR’s own data for their quality-minus-junk factor, as AQR publishes the constantly updated series. AQR’s quality-minus-junk factor goes long high-quality stocks and shorts low-quality stocks, with quality defined by profitability, change in profitability, and bankruptcy risk.
So what happened to these two factors in the beginning of 2022? To frame the discussion, 2022 began with a turning in the economic cycle. According to our definition of the economic cycle, which we define using the high-yield spread, we entered quadrant 3 (overheating) in December and moved to quadrant 4 (recession) in May.
Below are the base-rate returns for the Fama-French value factor (cheap minus expensive) and AQR’s quality-minus-junk factor within our cycle quadrants.
Figure 2: Long-Short Factor Returns Across the Economic Cycle, July 1963 – December 2021
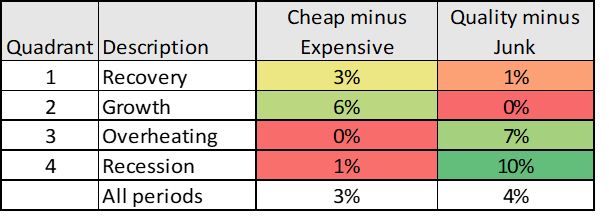
Source: Verdad, Ken French Data Library, AQR. Returns are annualized compounded returns. Quadrant definitions are coincident. Factor returns are the average of large- and small-cap factor returns.
Historically, cheap minus expensive (value) does best when the market is growing in quadrants one and two, while quality minus junk does best at the end of a cycle, quadrants 3 and 4. Our expectation then, was that quality would have outperformed in H1 2022.
That didn’t happen. Here are the returns for 2022 through May.
Figure 3: Long-Short Factor Returns, 12/31/2021 – 5/31/2022

Source: Verdad, Ken French Data Library, AQR. Factor returns are the average of large- and small-cap factor returns.
The long-short quality and value factors both did much better than long-only investments, but value did really, really well.
But the key to both factors’ performance was the short leg. The factor returns that we have been showing are the difference between the top and bottom 30% of stocks ranked by the factor. Below we show the returns of the long and short portfolios separately.
Figure 4: Returns by Factor and Long and Short Leg, 12/31/2021 – 5/31/2022

Source: Verdad, Ken French Data Library, AQR. Factor returns are the average of large- and small-cap factor returns.
Almost all the returns were driven by the short legs. The value factor did well because the expensive stocks did poorly, and the quality factor did well because junk stocks did poorly. The key to the first half, then, was to short the expensive junk stocks.
Is the opportunity over? We think there are a few reasons to hypothesize that factor returns could continue their run. The first is that expensive stock valuations are still historically high relative to cheap stock valuations.
Figure 5: Ratio of Expensive Stock Valuation Multiples to Cheap Stock Multiples

Source: Ken French Data Library. Annual data. Expensive is lowest 30% book to market, cheap is highest 30% book to market. Last value for 5/31/22 estimated from year-to-date returns.
The second is the return of inflation. Here the story is more anecdotal because we don’t have as much data, but when inflation is above 4%, the value factor appears to do much better.
Figure 6: Factor Returns by Inflation Level, 1963 – 2022

Source: Verdad, Ken French Data Library, AQR. Factor returns are the average of large- and small-cap factor returns.
In theory, higher inflation should drive up discount rates, which should make current cash flows more important to present value relative to future cash flows and thus drive value to outperform growth.
Finally, according to our high-yield spread metrics, we are still in a recessionary environment. If this proves to be true, then the outlook for low-quality, expensive stocks will continue to be bleak. Between high relative valuations, an inflationary backdrop, and a cyclical slowdown, expensive junk may have further to fall.
Acknowledgment: Clark Dean contributed to this piece. Clark is a rising senior at Harvard studying History and The Classics. A Florida native, Clark is seeking a job opportunity in his home state that will give him experience while he trains for the Paris 2024 Olympics in the sport of rowing.