Are Emerging Markets Cheap?
Jeremy Grantham, Boston’s resident bear, believes that emerging market stocks, particularly emerging market value stocks, offer the most compelling return profile of any category of equities. “Be as brave as you can on the EM front,” he advises clients. “Be willing to cash in some career risk units.”
Grantham bases his forecasts on a valuation metric devised by Robert Shiller known as the cyclically adjusted price-to-earnings ratio (CAPE) or “Shiller PE.” Rather than looking at equity valuations relative to the most recent twelve-month period, this metric compares equity valuations to the past ten years of earnings. On this metric, developed markets outside the United States look far cheaper than the US, and emerging markets look even cheaper.
Figure 1: CAPE Valuations by Region (Dec 31, 2017)

Source: CapitalIQ
But this picture looks different if you look not at CAPE valuations but at valuations based on last twelve month financials. Globally, the average EV/EBITDA multiple is 12.9x. The US today is at 14.3x; EM is at 13.8x.
Figure 2: Valuations Based on LTM Multiples

Source: CapitalIQ
And there is a significant spread in valuations across different emerging markets (perhaps unsurprisingly given the artificiality of grouping so many diverse countries into the category of EM). If you look at the nine largest emerging markets, which make up almost 90% of EM market capitalization, China and India are relatively quite expensive, while Mexico, Russia and Brazil are relatively cheap.
Figure 3: Valuations across Emerging Markets

Source: CapitalIQ
Why the discrepancy between CAPE and LTM valuations? We believe the big driver is commodity prices. One of the reasons that emerging markets look so good on a CAPE basis could be the big drop in commodity prices since 2014. This decline in commodity prices means that trailing ten-year average earnings in many EM countries are significantly higher than 2016 and 2017 earnings.
Figure 4: Emerging Market Stocks and Commodities

Source: CapitalIQ
When you look at CAPE ratios, which scale prices by average earnings over the past ten years, EM valuations are generally below the global average because commodity prices are so historically low today. But the implicit bet you’re making is that upward mean reversion in commodity prices will cause a rebound in EM earnings. And while that implicit bet makes sense for big commodity exporters like Russia or Brazil, it may make less sense for commodity importers like India and China.
We agree with Grantham on the case for buying the commodity-linked EM stocks: they are cheap relative to other markets around the globe, and mean reversion in commodity prices could provide an added tailwind. In fact, today we have about a 13% exposure in our global fund is to emerging markets that would benefit from a commodity rebound.
Historically, emerging market returns have been more volatile than developed market returns. However, we believe an allocation to emerging markets provides diversification benefits. Figure 5 illustrates this point by displaying the returns of two hypothetical backtested portfolios based on MSCI indices between January 1988 and December 2017. The “Developed Market Portfolio” allocates 60% to North America and 40% to EAFE. The “Developed + Emerging Market Portfolio” allocates 55% to North America, 30% to EAFE, and 15% to emerging markets, which is roughly in line with the relative market capitalization of each region. Both portfolios were rebalanced monthly. The Developed + Emerging Market Portfolio outperformed the Developed Market Portfolio by 1.5 percentage points over the period, and the volatility of the two portfolios was similar.
Figure 5: Hypothetical Portfolios: Developed Markets, and Developed + Emerging (1988–2017)
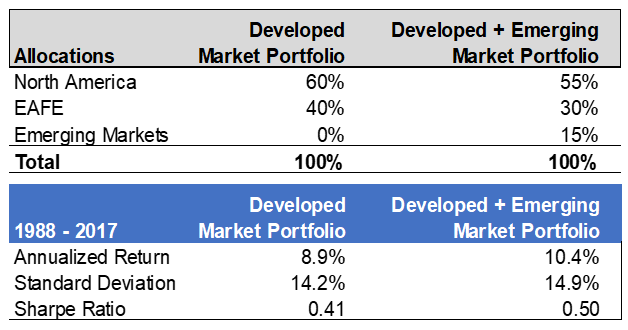
Source: MSCI
Maintaing a consistent allocation to emerging market equities over this 30-year period would have improved risk-adjusted returns by increasing the portfolio’s Sharpe ratio from 0.41 to 0.50. At Verdad we seek exposure to the highest expected returns. That means going where the value is greatest, which often involves allocating to assets that are more volatile. But as long as those additional assets have a lower correlation to our core portfolio, we can expect them to provide diversification benefits and improve risk-adjusted returns.