A Whale of a Tail: The Bank of Japan's ETF Hoard
Part II: Measuring the impact of material, dynamic, and correlated ETF fund flows.
By: Verdad Research & Sho Miyazaki
Last week we gave an overview of the growth of the Bank of Japan’s decade-long ETF purchasing program that came to a screeching halt for the first time this past year.
The BOJ case study in passive fund flows is pretty unique globally, given they’ve purchased 7% of the Japanese market and very precisely aggregated their daily purchasing data of passive ETFs for us. Most of the literature on the impacts of the program focused on the sizable stock price distortions early on when they were buying the price-weighted Nikkei 225 index. And most would assume that their more recent shift to buying only the cap-weighted TOPIX index would pretty much fix the earlier price distortion problems.
But we thought it would be interesting to see how the dramatic changes in fund flows to the TOPIX index from Japan’s largest shareholder seem to have impacted stock prices. Passive stock ownership is now over 50% in other developed markets, cap-weighted indexes are the norm, and nobody knows for sure what happens when those net fund flows to passive slow down after a decade of meteoric increase (like the BOJ’s just did).
So we took a look at individual stock price movements of TOPIX constituents while the BOJ was buying almost exclusively the TOPIX index. We were suspicious because what causes short-term price distortions is not fund flows relative to market cap (or free-float market cap). More fundamentally, in the absence of any new relevant information about the intrinsic value of a stock, the price moves up relative to the market when there are not enough dollars of stock value (volume) from sellers willing to sell on a given day relative to the dollars from buyers intent on buying.
To highlight this intuitively, consider two of the biggest and most well-known companies on the TOPIX: Toyota and Softbank. Toyota has the highest free-float market cap at 2.5 times that of Softbank. However, Softbank has double the daily trading volume of Toyota. Theoretically, the company stock with more free-float weight (purchased a lot by TOPIX ETF construction rules) and less daily trading volume would be more sensitive to the large-scale purchase of an ETF tracking the TOPIX.
To highlight this empirically, we calculated a weight/volume index with free-float weight and daily trading volume, indexed that to 1 at the median weight/volume stock, and grouped by deciles. This index tells us the magnitude of how crowded the BOJ’s trades through the TOPIX are on an individual stock level. For example, Toyota is grouped in decile 8 (more crowded due to its relative lack of trading volume), and Softbank is in decile 2 (less crowded due to its relatively high trading volume).
For all ~2,300 TOPIX constituents, below we show what % of the total daily trading volume of different stocks the BOJ would have to purchase on a given trading day at different BOJ aggregate daily ETF purchase amounts. These purchase amounts have been frequently used by the BOJ over the last 1.5 years. Highlighted in red are the amounts above the 10% threshold, which Wall Street traders typically try to keep their volume below to avoid moving the price of a stock.
Figure 1: TOPIX Allocation Relative to Daily Trading Volume

Source: BOJ, TSE, and Capital IQ
The cap-weighting structure was clearly not a panacea, as shown by the sea of red in the table above.
At the peak of the BOJ’s buying in March of last year (right column of chart above at ~$2 billion a day of ETF purchases), they were buying approximately 50% of the daily trading volume of the most crowded 10% of TOPIX stocks but only 1.7% a day of the 200 least crowded stocks on the index. Any trader will likely tell you that a buyer who will pay any price to buy 50% of the daily trading volume of a stock in one session will likely move the bid-ask spread up for that day for non-fundamental reasons. An index construction rule, however, cares less that the “price is right” and more that the index-weighting requirement is satisfied.
The BOJ purchased at different amounts throughout the period, so what did it take to move prices of individual stocks on individual trading days? Below we show the price impact during these buying sprees for the same deciles of TOPIX constituents.
Figure 2: Price Impact of BOJ Purchases at Different Purchase Amounts

Source: BOJ, TSE, and Capital IQ. This is a premium relative to the market’s median stock movement that day. The BOJ typically bought in afternoon trading session any day the market had traded down 0.5% or more in the morning, although they have since abandoned that pattern.
Indeed, in daily trading, the BOJ TOPIX ETF purchases seemed to have a fairly consistent price distortion across deciles, and the distortion increased with the BOJ’s daily buying amounts. The more the BOJ dumped into the TOPIX, the more the distortion on that day. For example, on the four days the BOJ bought its peak amount of $2 billion (right-most column above), the least subsidized stocks (decile 1) closed with an average premium of -1.84% relative to the median TOPIX constituent on those days. And the most subsidized stocks (decile 10) closed with a premium of +1.37% relative to the market that day. The daily price movement effects were pretty monotonic.
But what is perhaps more interesting is what happened on the days the BOJ was not buying. To the extent there is arbitrage occurring, markets should correct when prices rise for non-fundamental reasons. We would expect short-term reversals if any warm bodies are actually trading the underlying index constituents. And indeed, on the 280 days the BOJ stopped buying, we saw a general reversal of the prices of the stocks the BOJ had “overbought” and “underbought” under the TOPIX construction rules.
Was this statistically significant? To test, we initially ran regressions of the weight/volume index on the return premium of every stock listed in the TOPIX on each of the 369 trading days from January 2020 to July 2021.
Below are the estimated price impact effect sizes on each trading day associated with being “overweight” relative to trading volume under the TOPIX index construction rules. The vertical lines show the 95% confidence intervals, and the background bars show the BOJ ETF purchases on each day.
Figure 3: Regression of Price Impact of BOJ TOPIX Purchases 2020–2021

Source: BOJ, TSE, and Capital IQ. The model is a logarithmic scaled OLS regression parametrized with median: log(y return premium) = α + β⋅ log(x weight/volume) + ϵ. The coefficient can be interpreted as a 1% increase in the weight/volume index estimated to be associated with a β% increase in the return premium.
While the BOJ purchases through the peak of the program in March of 2020 appear to have had a pretty strong distortionary effect, the aggregate trend is quite unreliable after that. Indeed, after the peak of BOJ buying, the subsequent 58 buying sessions had almost as many statistically significant negative effect days (37.9%) as the statistically significant positive effect days (53.4%) we would have expected under the distortionary hypothesis.
We would expect (and did see) short-term reversals of the most crowded stocks on the TOPIX weight/volume index when the BOJ was not buying. However, what is striking is just how consistently negative the weight/volume index was for the entire 14 months as the ETF purchase program began drawing down.
This suggests a potential unwinding of a long-term cumulative effect after the BOJ’s fund flows to passive dried up after nearly 10 years of steadily escalating purchases.
To test a few indicators of the potential cumulative impact of the escalation and end of the BOJ purchases, we measured the valuation changes and price returns of each of the weight/volume index deciles over the same time horizon.
Below is the change in the P/B ratio of each decile of the weight/volume index for all TOPIX constituents. We index the average valuation of each decile to the beginning of January 2020 before the BOJ started ramping up the program.
Figure 4: Change of Indexed P/B Ratio by Decile Group

Source; BOJ, TSE, and Capital IQ
When COVID-19 hit the market and the BOJ doubled its daily purchases, the less subsidized stocks in decile 1 experienced valuation drops significantly more than the stocks in the highest decile group. This trend is consistent with what we hypothesized: stocks with the highest weight/volume ratios become overpriced relative to the market after the BOJ buys. Quantitative easing “worked” in the short term, and the most subsidized stocks “benefited” the most.
But, as the program began to slow down for the first time in a decade, the least “subsidized” stocks in the lower decile recovered much more rapidly and did even better than before the recession, suggesting a potential unwinding of a long-term impact in line with the 20% noted in the Nikkei 225 literature studies through 2017.
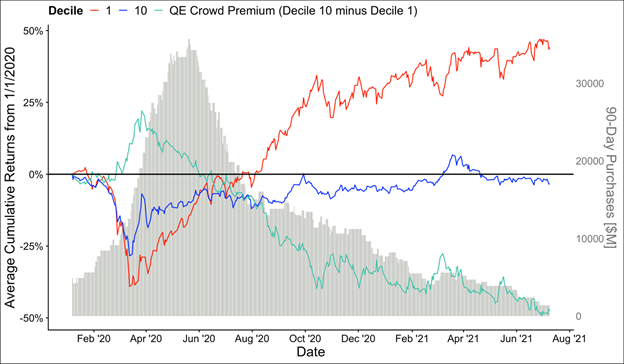
And price returns for these stocks reflected their short-term and long-term valuation divergences. Figure 5 below shows the difference of average returns of decile 1 stocks and decile 10. You earned quite the premium for staying out of the most crowded QE stocks when the fund flows stopped.
Figure 5: BOJ QE Crowd Premium
Source: BOJ, TSE, and Capital IQ
It’s difficult to attribute precise causality here or say what happens next. We’re looking at what appears to be the tail of the whale, and the BOJ has still yet to ever sell once.
But what is perhaps reassuring to those worried about positioning for the unpredictability of such political actions and the splash they may cause is what did work here. What worked didn’t require expertise in political science or painstaking measurements of BOJ fund flows, index weights, and trading volume.
Instead, simply erring toward stocks whose valuations had remained relatively low on the basis of their fundamental financials kept you in premium territory. Without knowing a thing about central bank politics, the Japanese, or Keynesian macro theory, any investor would have done just fine here picking up stocks that sold at a relative discount and staying away from stocks whose valuations had increased dramatically. Simple value investing principles exercised with discipline would have avoided the most correlated and overcrowded trades at the whale’s tail.
But if these observations here are true about the impact of the end of 10 years of unequal subsidies, then there may be implications for other passive fund flows globally, which are harder to measure than the BOJ case study. This is because most all major ETF retail providers use free-float capitalization weighting like the BOJ’s TOPIX target.
The BOJ now owns ~7% of aggregate market cap in Japan, and we have a year-long lookback to evaluate their program after buying came to a screeching halt. To answer Fama’s question of how much does it take for the government to move the market: 7% in ETF inflows may have been enough in Japan. With the rest of developed world equity markets at >50% passive now, it is possible there are other, equally unpredictable and even bigger whales tails from long-term fund flow trends that can’t continue in perpetuity.
Acknowledgement: Coauthor and summer intern Sho Miyazaki is a rising junior studying political science at Keio University in Tokyo, where he also works as a performance data analyst of the varsity rugby team. After studying at Harvard College as a visiting student, he is now actively seeking career opportunities in finance and data science. Please reach out to us if you would like to connect with Sho.